Data for sustainability-oriented studies and actions in the apparel sector
|
|
|
- Clarence Robbins
- 6 years ago
- Views:
Transcription
1
2 Data for sustainability-oriented studies and actions in the apparel sector
.")
3 This work is licensed under the Creative Commons Attribution-NonCommercial 4.0 International License. Credits This publication is the main result of a research project with the same name, developed during the first semester of 2017 with funds awarded by the programme KIEM VANG (SiA). The project was hosted at the Amsterdam University of Applied Sciences (CREATE-IT Applied Research) and involved a consortium of partners including NGO s, companies, charitable organizations and knowledge institutions (Saxion, Modint, Circle Economy, Sympany and MVO Nederland). Graphic design by Silvio Lorusso and Dylan Degeling of the PublishingLab.


, AUAS.")

4 Irene Maldini Researcher at CREATE-IT, AUAS. Laura Duncker Researcher at CREATE-IT, AUAS. Lidian Bregman Student Fashion & Management at Amsterdam Fashion Institute (AMFI), AUAS. Gunilla Piltz Student Fashion & Textiles Technologies at Saxion. Contributors


5 Lisa Duscha Student Fashion & Textiles Technologies at Saxion. Gwen Cunningham Program Lead in Circle Textiles Programme at Circle Economy. Marc Vooges Director at Sympany. Theresia Grevinga Researcher at Saxion. Contributors

 Marian Mclaughlin (AUAS) Anonymous interviewees (Dutch sorters and collectors of PCT)")
6 Rens Tap Business developer at MODINT. Fioen van Balgooi Knowledge Manager in Circular Economy and Climate at MVO Nederland. Acknowledgements We are grateful for the contributions of: Hein Daanen (VU Amsterdam) Rebecca Breuer (AUAS) Gino Thuij (GfK) Marian Mclaughlin (AUAS) Anonymous interviewees (Dutch sorters and collectors of PCT) Volunteers participating in the container analysis session Bernd Gulich and Adele Rinck Contributors
7 1. Purchase 2. USE The Dutch clothing mountain 46 items bought annually per person in each p wardrobe items in active use. 7 Source: GFK. Includes clothing, footwear and accesories. Source: Measuring the Dutch Clothing Mo based on a small, non-represantative sam added on the basis of Euromonitor data (s account for 1 item).
8 3. disposal items ersonal. 40 items are annually disposed of per person. 50 items in the wardrobe are second-hand. items were not worn in the past year. untain. Wardrobe information is ple. Underwear and socks are ets or packages of underwear items are disposed with non-textile materials and therefore incinerated items items are separately collected: items are rewearable and suitable for the international second-hand market. items are not suitable for reuse. These can be recycled. items are potentioally rewearable according to the consumer, but do not meet the international second-hand standards. per year are wasted before arriving to the consumer. Sources: MVO Nederland, CBS, Rijkswaterstaat & Measuring the Dutch Clothing Mountain. Destiny of separately collected textiles is based on container analysis (non-representative sample). Pre-consumer waste calculated on the basis of MVO Nederland percentage and GFK volumes. The project measuring the Dutch clothing mountain was funded by SiA s KIEM-VANG programme. Download the final report here
9 Table of Contents Introduction... 1 Chapter 1: Purchase Retail Volume Retail Value Value per item (Household) Spending on clothing, footwear, and textiles...11 Chapter 2: Use Introduction Sampling and recruitment Comparison with German wardrobes Conclusions including qualitative aspects Chapter 3: Disposal Pre-consumer waste volumes Post-consumer textile waste Volumes of textile waste Local collecting and sorting organizations Post-consumer clothing and footwear waste Textile waste destinations Textile volume incinerated Textile sorted Textile reused locally Textile recycled locally Textile volume exported... 38
10 3.4 Textile container analysis Methodology and general results Product types Materials Fibre composition Conclusions International comparison of post-consumer textile volumes and management United Kingdom Denmark Germany France Conclusions Chapter 4: Conclusions Summary of the research findings for the general public Recommendations to reduce Dutch textile waste Recommendations for further research Glossary References...67
11 Introduction This report aims at sharing knowledge relevant for sustainability-oriented studies and actions in the Dutch apparel sector, with a focus on clothing volumes. The apparel industry is said to be one of the most polluting at a global level; however, we find that discussions of its environmental challenges or the actions needed to tackle them are often based on superficial or unreliable information. This information is frequently disseminated by word of mouth and non-scientific texts and finally accepted as valid. Moreover, some actors working on practice-based solutions for the environmental challenges of the apparel industry build solutions and projects based on these facts. As a result, these actors risk focussing on topics that are not as critical or relevant as was originally thought. Clear, reliable data is needed to pinpoint the true challenges and bottlenecks within the fashion system. One example is the popular sustainable fashion strategy of production on demand. This strategy is based on the common belief that 30% of the clothes that are produced within the ready-made industry do not reach the consumer and are wasted. The original source of this percentage is unknown, but it has been used repeatedly in publications and events in the Netherlands. If manufacturers are producing more than consumers actually want, starting by individual consumer demand may be an effective approach to diminish clothing waste. However, previous research has pointed out that this percentage is around 6% including production mistakes (see section 3.1). In this context, the efficacy of turning the whole supply chain up side down with the aim of reducing pre-consumer clothing waste may be questioned. Another knowledge gap tackled by this report is that of national data. Sustainable fashion knowledge and actions within the Dutch context are often based on foreign publications. The UK and Scandinavia have been pioneers in the production of knowledge relevant 1
12 for the field, therefore local studies and actions tend to generalize that information, before applying it to the Dutch context. However, in this report we show that trends in purchase, use, and disposal of clothes can be different across western and northern European nations. For example, Euromonitor s data show that the amount of clothes bought per year by Dutch consumers has been diminishing slowly since 2007, while it has grown considerably in the UK and Denmark (see Chapter 1). The information compiled in this report focuses on the volumes of clothes bought, used, and discarded by consumers in the Netherlands, assuming that most garments consumed locally are produced abroad. Some sections are based on information that was previously published elsewhere, while other knowledge was generated within this specific research project. Chapter 1 focuses on the purchase phase and it is based on information published in Euromonitor databases and provided by the consumer research company GFK. What we intend with this chapter is to make this information more accessible to readers in the field. We focus on the Dutch apparel sector, presenting the data in a comprehensive way. For example, we compare retail volume per capita and retail value per item in order to promote the appropriation and dissemination of this information. Chapter 2 presents data about the use phase, gathered within this research project. We visited 50 individuals equally distributed in terms of age, gender and domicile, and counted the amount of garments in their wardrobe, discriminating those clothes that had not been used during the last year and the ones that had been used by other people before (second hand). Moreover, the chapter includes a similar study of German wardrobes and compares the outcomes of both surveys. Chapter 3 is about clothing disposal and includes data from a variety of sources. Pre-consumer waste information is based on a previous study done by MVO Nederland. Post-consumer waste data is gathered by a review of existing publications and statistical data. This information is complemented by a series of interviews with post-consumer textile collectors and sorters. Moreover, in the con- 2
13 text of this research we sort and analyse 200 kg of textiles disposed by Dutch consumers in detail. Although the main scope of this publication is to promote realistic and accurate strategies to tackle the issue of clothing volumes in the Netherlands developed by others, we advance some recommendations to reduce overall clothing volumes based on the results of this research in chapter 4. The time frame considered in this report is Within this period, some significant events affecting the Dutch apparel sector took place. For instance, 2009 saw the critical point of the economic crisis (see fig. 0.1); moreover, this period coincides with the popularization of fast fashion; lastly, a growing awareness of the social and environmental effects of the clothing industry follows the collapse of the garment factory Rana Plaza in Bangladesh in These and other issues can be linked to the data presented in this report in order to put it in context. Figure 0.1: Real GPD Y-O-Y growth in the Netherlands and other countries in the region (%). Source: Euromonitor With this report we hope to contribute to the development of a more responsible apparel sector in the Netherlands. However, we consider this a small first step towards the generation and dissemination of relevant knowledge. The lack of information in the sector is remarkable, hence the brief list of references included in the lit- 3
14 erature review. A structural plan for knowledge production is needed, in order to enable historical and international comparisons. We include some recommendations in chapter 4. Are synthetic materials substituting natural ones in domestic consumption? Are Dutch wardrobes growing? Is the lifespan of products getting shorter? Which kinds of textile products are usually discarded via household waste and which via textile collection? What role do demographic characteristics of individuals play in the variables above? The answers to these and other questions are unknown for us, and we believe most of them have not been uncovered yet. Informed readers are encouraged to contact us with suggestions of sources that may not be included here. 4
15 Chapter 1: Purchase 1.1 Retail Volume Figure 1.1 shows historical retail volume of apparel and footwear in the Netherlands and other countries in the region on the basis of Euromonitor s figures. This is the volume of sales to consumers, in this case the number of items of apparel and footwear sold annually in each country. This includes online retail and excludes second-hand clothes and informal retail such as street markets. Sometimes items include more than one garment, such as in packaging including several pairs of socks, and sets of underwear. Accessories such as hats and scarves are included but bags (travel goods) are excluded. These volumes account for the number of items per capita shown in figure 1.2. According to Euromonitor (2017), the amount of clothing items sold per capita was growing slowly but steadily in Western and North European countries until around The popularization of fast fashion retailers, the economic crisis, environmental and economic policies or environmental awareness may have had particular effects in different countries. Figure 1.2 shows how after that year national consumption rates have differed. For example, in the UK annual individual purchases escalated up to 36.7 items in 2016, while Denmark reached its peak between 2007 and 2010, with 37.8 items. France and the Netherlands, on the other hand, have been slowly decreasing their volume per capita since In Germany developments have been more predictable, with a small increase in purchase rates during the last 15 years. 5

16 Figure 1.1: Market Sizes Historical Retail Volume in million units. Source: Euromonitor statistics Netherlands France Germany United Kingdom Denmark Figure 1.2: International Market Sizes Retail Volume units Per Capita. Source: Euromonitor statistics According to Euromonitor, the average Dutch person bought 26 items of apparel and footwear in The peak of retail volume, approximately 30 items per capita, was in From 2009 onwards the amount of items per person decreased. The difference between 2002 and 2016 is three items (see fig 1.3). 6
17 When comparing these figures with reported volumes of post-consumer waste (see section 3.2.3), we note that Euromonitor s estimations for retail volume in the Netherlands are too low. The fact that informal retail, such as street markets, is not accounted for may partially explain this difference Figure 1.3: Dutch Market Size Retail Volume units Per Capita. Source: Euromonitor statistics GfK (2017), a consumer research company operating in the Netherlands, estimates higher volumes in the sector of fashion, shoes and accessories. The main difference between Euromonitor and GFK methods is that the former is based on data provided by companies while the later accounts for consumer data. Moreover, GfK includes purchases of Dutch inhabitants made abroad, informal retail (e.g. street markets) and counts items sold in packages (e.g. including several pairs of socks) separately. Their estimates are illustrated in figure 1.4. These figures (which exclude second-hand items) seem more consistent with waste volumes (see section 3.2.3). Both organizations identify a reduction in the retail volume per capita. However, GfK recognizes this trend later in time, around 2011, and estimates an increase in the items bought from
18 Figure 1.4: Fashion, shoes and accessories bought per capita ( ). Source: GfK consumer panel. Market: Total Fashion, Shoes & Accessories (excluding jewellery, bijoux and watches). 1.2 Retail Value 80,000 70,000 60,000 50,000 40,000 30,000 20,000 10, Netherlands France Germany United Kingdom Denmark Figure 1.5: Market Sizes Historical Retail Value RSP million Current Prices Year-on Year Exchange Rates. Source: Euromonitor statistics Figure 1.5 shows historical retail value in the Netherlands and other countries in the region on the basis of Euromonitor s figures. This is the total value of apparel and footwear sold to consumers per year, 8
19 per country. The value includes online purchases and excludes second-hand clothes and informal retail such as street markets. In analysing figure 1.5, the influence of exchange rates (pounds to euro) must be considered. Year-on-Year exchange rates might say more about the irregular UK retail value line in fig 1.5 than actual retail value when it is accounted in pounds (see fig 1.6). 60,000 50,000 40,000 30,000 20,000 10, Figure 1.6: Market Sizes Historical Retail Value RSP million Current Prices Year-on- Year Exchange Rates. Source: Euromonitor statistics 14,500 14,000 13,500 13,000 12,500 12,000 11,500 11,000 10,500 10, GFK Euromonitor Figure 1.7: Total retail value and consumer spending in apparel and footwear (NL) according to Euromonitor and GFK (in mn ). 9
20 Figure 1.7 compares retail value changes in the Netherlands according to Euromonitor and consumer spending according to GfK since A general trend of lower value in the sector is identified by both organizations. However, there are significant differences around In line with differences in retail volume discussed above, GfK estimates a peak during 2010 while for Euromonitor the highest figures are those of Value per item Figure 1.8 shows international developments in the average value of each item (in ) according to Euromonitor. These are calculated by dividing retail value per retail volume annually. Again, the influence of exchange rates for the irregular representation of UK numbers should be taken into account. Rendering from these figures, the average value of French items has been stable at around 23, while German items have increased their value by around 1. The average value for Danish and Dutch items has dropped significantly, by around 3 during the last 15 years Netherlands France Germany United Kingdom Denmark Figure 1.8: Market Sizes Historical Retail Value RSP Unit Price per unit Current Prices Year-on-Year Exchange Rates. Source: Euromonitor statistics Fig 1.9 compares average value per item in the Netherlands according to Euromonitor and GfK data. The methodological differences introduced in section 1.1 should be considered when analysing this figure. Estimates from both organizations are considerably differ- 10
21 ent, with Euromonitor s data pointing to an average price of per item during the last 10 years, while GfK indicates approximately 16. Furthermore, Euromonitor s figures show a decline in prices while according to GfK prices have been relatively stable. Overall, when compared with each other, Euromonitor estimates less items sold at higher prices, while for GfK more items have been sold at lower prices GFK Euromonitor Figure 1.9: Average value per item of clothing and footwear according to Euromonitor and GfK ( ). Despite the difference between sources, clothing prices have become cheaper in comparison with the increase in all consumer prices (general inflation). Since 2002, the general inflation in the Netherlands rose by about 25%; therefore, clothing prices have been decreasing at least in relative terms (CBS n.d.). 1.4 (Household) Spending on clothing, footwear, and textiles The national statistics office of the Netherlands (CBS, Centraal Bureau voor de Statistiek) maps household spending on textiles and clothes, excluding leather. Their estimates are not directly comparable with those of Euromonitor and GfK due to a difference in the items included (CBS includes home textiles and excludes 11
22 footwear, while Euromonitor and GfK exclude home textiles and include footwear). However, by looking at their figures next to each other (fig 1.10), other differences arise, with methodological issues probably playing a larger role than product categories. In any case, their estimates get closer in recent years. All three sources point to a reduction in annual spending during the last ten years. For Euromonitor and GfK, this coincides with a drop in retail volume per capita (amount of items bought per person) and retail value per item (price per product). We highlight the need for more detailed analysis of these issues in future research GFK Euromonitor CBS Figure 1.10: Annual retail value / spending per capita ( ). Comparison of GfK, CBS and Euromonitor data. 12
23 Chapter 2: Use 2.1 Introduction This chapter describes the methods and results of a wardrobe study of fifty individuals living in the Netherlands. The objective of this research was to find out how many garments are kept in Dutch wardrobes and how many have not been worn within the last year. Previous international studies have pointed out that wardrobe sizes have increased throughout history (Klepp & Laitala 2015); therefore, an assessment of the current state of affairs is a starting point for future historical studies. To our knowledge, there have not been previous studies of Dutch wardrobes that are quantitative and reliable. Ruigrok Netpanel (Vlek & de Jongh 2016) did an online survey for Marktplaats on the number of garments kept by Dutch consumers and how many are not in use. Nevertheless, this research is based on estimations of respondents collected by phone inquiry and it is therefore not accurate. By examining Dutch wardrobes and counting the number of garments owned we provide a more accurate approximation to this issue. 2.2 Methodology Sampling and recruitment The wardrobe study was carried out with fifty respondents living in the Netherlands. Although the sample is not representative of the Dutch population, an explicitly varied selection was made. Table 2.1 shows how respondents were distributed equally according to three criteria: gender, age and locality. The study was carried out by Lidian Bregman, a Fashion Management student from Amsterdam Fashion Institute as part of her graduation project. Recruitment of 13
24 respondents started by asking her family, classmates and friends and continued based on their indication in order to meet the sample requirements described above. The final sample includes fifty people. Most of the respondents living in small cities, towns and villages are from the north of the Netherlands. Table 2.1: Distribution of 50 respondents according to sampling criteria Male Female Town / village Small City Large City Town / village Small City Large City < inhabitants inhabitants > inhabitants < inhabitants inhabitants > inhabitants RWR03 RWR09 RWR09 RWR01 RWR08 RWR RWR11 RWR15 RWR15 RWR16 RWR22 RWR25 RWR33 RWR14 RWR14 RWR36 RWR17 RWR07 RWR19 RWR30 RWR30 RWR23 RWR27 RWR RWR26 RWR24 RWR24 RWR18 RWR29 RWR42 RWR32 RWR28 RWR28 RWR31 RWR35 RWR43 RWR10 RWR20 RWR20 RWR02 RWR04 RWR RWR05 RWR21 RWR21 RWR12 RWR44 RWR40 RWR13 RWR34 Total Table 2.4 shows the average number of garments owned by Dutch individuals in relation to the sample variables: gender, age and location. These results should be considered in perspective, taking into account that this is a non-representative sample. However, given that there are no previous studies with these characteristics, the table can be useful to formulate hypotheses for future studies including bigger samples. 14
25 Table 2.2: Template used for the wardrobe study Garment type Number of garments in wardrobe Of which unused Of which second-hand Coats and jackets (including rain jackets and sport jackets) Shoes and boots (pairs) Bags (only bags used as clothing accessories, excluding shopping bags, for example) Scarves and shawls Hats Gloves (pairs) Suits Trousers Jeans Shorts (including sportswear) Sweaters and cardigans Short-sleeve T-shirts and tops Long-sleeve T-shirts and tops Blouses and Shirts Dresses Jumpsuits Skirts Other Columns 1 and 2 in table 2.4 show differences in the number of garments owned by men and women. On average, women in this respondent group own 60% more clothes than men (162 and 99 respectively). Moreover, women own more second-hand garments and almost double of the number of unused garments than men. Secondly, there are differences in the number of garments owned by the three age categories. Columns 3 to 5 show that respondents with an age between own on average more garments 15
26 (170) than those with an age between (134) and 50+ (75). The number of second-hand clothes is also the highest in this group. Thirdly, the number of garments varies in relation to locality (columns 6-8). Respondents living in large and small cities own more garments (149 and 140 respectively) than respondents living in villages/towns (104). Women between years old living in large cities own most of the second-hand and unused garments. Table 2.3: Individual outcomes of the wardrobe count Respondent number [1] Age category [2] Gender [3] Locality [4] Estimated number of garments [5] Total number of garments [6] Unused garments [7] Percentage use [8] Second-hand garments [9] Percentage secondhand [10] RWR Female Town/village % 5 3% RWR Female Town/village % 0 0% RWR Male Town/village % 1 1% RWR Female Small city % 5 2% RWR Male Town/village % 0 0% RWR Female Big city % 22 9% RWR Female Big city % 19 9% RWR Female Small city % 26 17% RWR Male Small city % 6 9% RWR Male Town/village % 0 0% RWR Male Town/village % 7 22% RWR Female Town/village % 0 0% RWR Male Town/village % 0 0% RWR Male Small city % 15 8% RWR Male Small city % 1 1% RWR Female Town/village % 0 0% RWR Female Small city % 16 6% RWR Female Town/village % 9 8% RWR Male Town/village % 0 0% RWR Male Small city % 0 0% 16
27 RWR Male Small city % 0 0% RWR Female Small city % 23 12% RWR Female Town/village % 6 4% RWR Male Small city % 1 1% RWR Female Big city % 29 9% RWR Male Town/village % 4 4% RWR Female Small city % 4 3% RWR Male Small city % 0 0% RWR Female Small city % 8 7% RWR Male Small city % 5 4% RWR Female Town/village % 19 7% RWR Male Town/village % 9 7% RWR Male Town/village % 3 6% RWR Female Town/village % 4 4% RWR Female Small city % 26 8% RWR Female Town/village % 6 9% RWR Male Big city % 0 0% RWR Female Big city % 4 4% RWR Male Big city % 0 0% RWR Female Big city % 0 0% RWR Female Big city % 18 8% RWR Female Big city % 14 9% RWR Female Big city % 5 5% RWR Female Town/village % 0 0% RWR Male Big city % 22 9% RWR Male Big city % 3 2% RWR Male Big city % 0 0% RWR Male Big city % 5 12% RWR Male Big city % 0 0% RWR Male Big city % 8 4% 17
28 Table 2.4: Average number of garments in Dutch wardrobes according to sampling variables Gender Age Locality Female [1] Male [2] [3] [4] 50+ [5] Town/village [6] Small city [7] Large city [8] Average total Average second-hand Average unused garments Table 2.5 shows the composition of the average wardrobe within this sample regarding number of clothes, number of second-hand clothes, and number of unused clothes per garment category. The larger garment groups are those of upper wear, such as T-shirts, shirts and sweaters (rows 11-14). Hats, scarves and shawls, skirts, dresses, and jumpsuits (rows 4-5 and 15-17) are the garment types more commonly unused. Second-hand pieces are more common in accessories (bags and hats, rows 3 and 5) and dresses (row 15). Table 2.5: Number of garments per category Total number of garments Average per person Total unused Percentage unused Total secondhand Percentage second-hand Coats and jackets (including rain jackets and sport jackets) [1] % 16 6% Shoes and boots (pairs) [2] % 9 2% Bags (only bags used as clothing accessories, excluding shopping bags, for example) [3] % 20 9% Scarves and shawls [4] % 14 6% Hats [5] % 14 8% Gloves (pairs) [6] % 3 3% 18
29 Suits [7] % 2 4% Trousers [8] % 21 4% Jeans [9] % 28 7% Shorts (including sportswear) [10] % 9 3% Sweaters and cardigans [11] % 51 7% Short-sleeve T-shirts [12] % 75 6% Long-sleeve T-shirts [13] % 9 2% Blouses and shirts [14] % 34 6% Dresses [15] % 17 9% Jumpsuits [16] % 2 4% Skirts [17] % 10 7% Other [18] % 25 11% Total % 359 6% 2.4 Comparison with German wardrobes In the context of this research, Lisa Duscha, a Textile and Fashion Engineering and Management student at the Saxion University of Applies Sciences in Enschede did a similar wardrobe study in Germany. Although these samples are not representative of the national population, respondents were selected using the same criteria. The investigation mainly took place in the west and north-west of Germany. Some results of this survey are shown in table 2.6. The wardrobe sizes in the German group are somewhat bigger than in the Dutch group. Both studies show that women own more clothes than men, which also applies for the number of second-hand and unused garments. However, within the German group there are smaller differences between genders. Male German respondents owned more garments than Dutch ones (135 to 99). Columns 3-5 show differences in the number of garments in relation to age. In the Dutch group, respondents aged have the 19
30 largest number of garments in their wardrobe. This differs from Germany where respondents aged have bigger wardrobes (178 pieces). Although respondents in this group have more garments in their wardrobe, it is those between years old than own the majority of second-hand garments (21 pieces in average). In both countries, the number of second-hand garments is the highest in this age category. Moreover, in both countries respondents living in large cities own the greatest number of garments. However, the numbers in the German group are more homogeneous. In the Dutch group, it was the same sector (young females living in large cities) that owned larger wardrobes and more second-hand garments; however, this relation is not found in Germany. Within this group, second-hand clothes are infrequent in big cities. Lastly, in both countries the number of unused garments is related to wardrobe size. The average percentage of unused garments is 28% in the Netherlands and 30% in Germany. The garment categories more commonly unused are similar, as are those including second-hand items. Table 2.6: Average number of garments in German wardrobes according to sampling variables. Gender Age Locality Female [1] Male [2] [3] [4] 50+ [5] Town/village [6] Small city [7] Large city [8] Average total Average second-hand Average unused garments
31 2.5 Conclusions including qualitative aspects In addition to the quantitative aspects discussed above, there are a few qualitative findings concluded from this research. To begin with, people with larger wardrobes are not aware of what they own. Moreover, 28-30% of all garments owned by respondents are not actively used within one year. These garments could be reused or recycled to substitute the production of new clothes and materials. One suggestion for consumers is to limit their wardrobes to usable numbers, so that they can keep track of what they own and consider it at the moment of buying. On the other hand, motivations to keep clothes among respondents were not always practical. Some of the reasons mentioned were their sentimental and financial value. Moreover, respondents hoped for a future body change that would enable them to wear old garments again. For example, one respondent argued: I keep the garment, although it is not my style but I got it as a present. Another respondent claimed that although the garment is broken and not repairable, I keep it because I have paid a lot for it. Many respondents were not interested in second-hand clothing. Second-hand is more common among younger women in large cities, which means there is potential for more reuse in those groups. Additionally, the number of unused garments is also the highest in this group, meaning that there are enough garments suitable for exchange. Lastly, a promising field of intervention is that of promoting the practice of using second-hand clothes in other groups. Actions may vary from private initiatives (such as developing more sophisticated and easy to use digital platforms for clothing exchange, or specific laundry services to reduce concerns related to hygiene) to public policy (such as advertisement campaigns highlighting the value of reuse). This line of intervention may contribute to use existing resources more intensively and to partially substitute the production of new items. 21

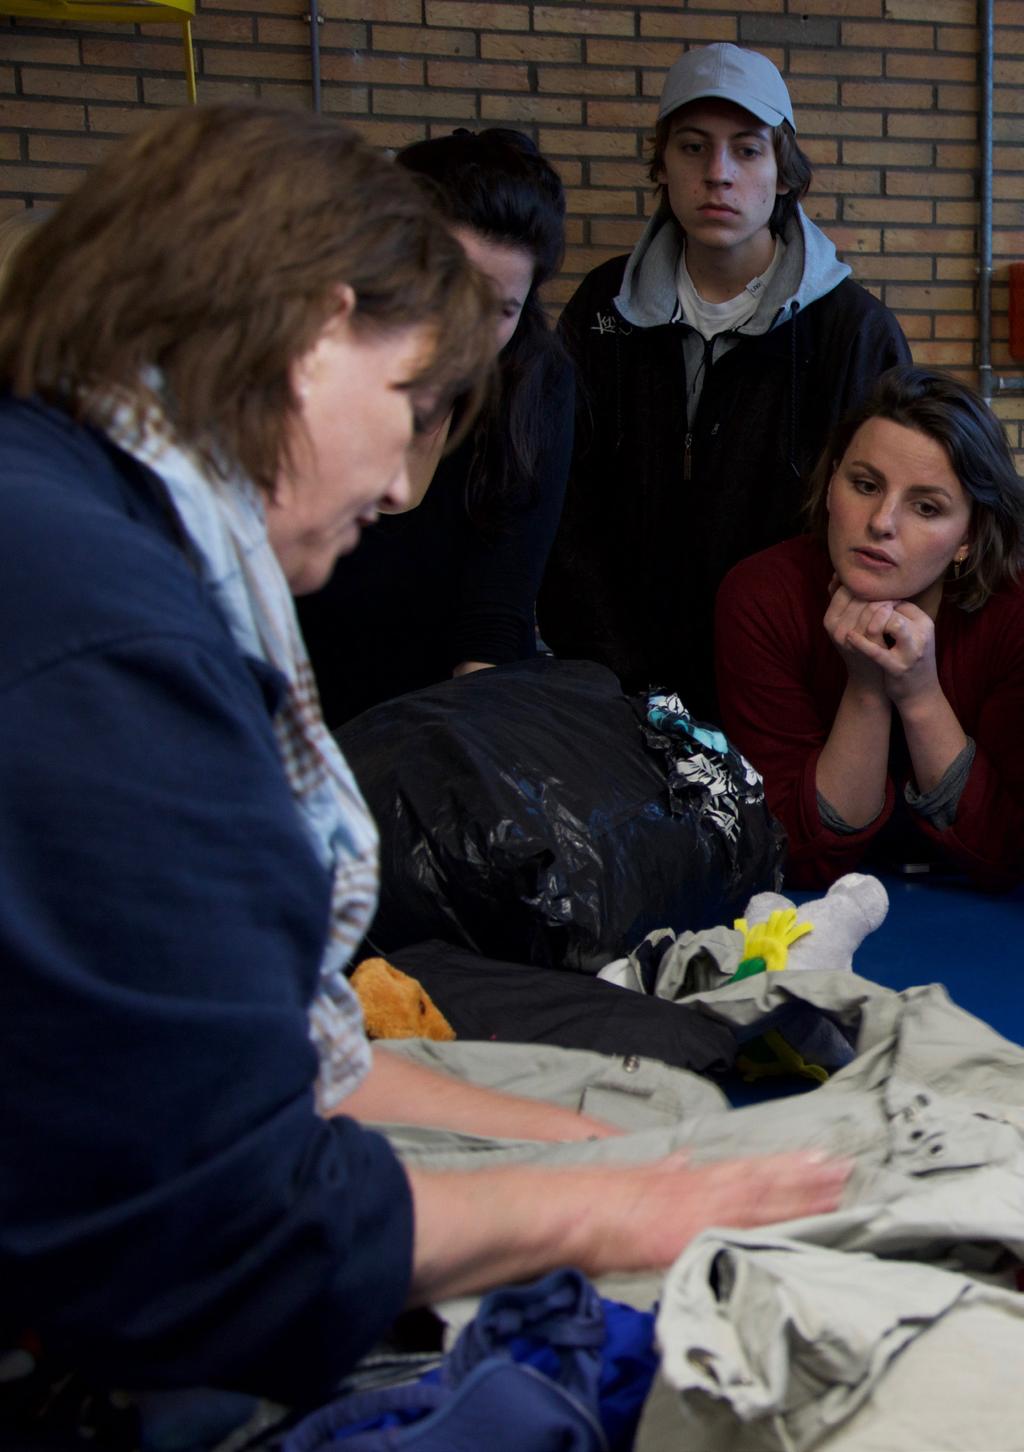
32 Photo credits: Hans van de Woerd for IKcircuLEER.nl
33

34 Figure 3.7: Sympany s staff training volunteers to identify rewearable and non-rewearable garments.
35

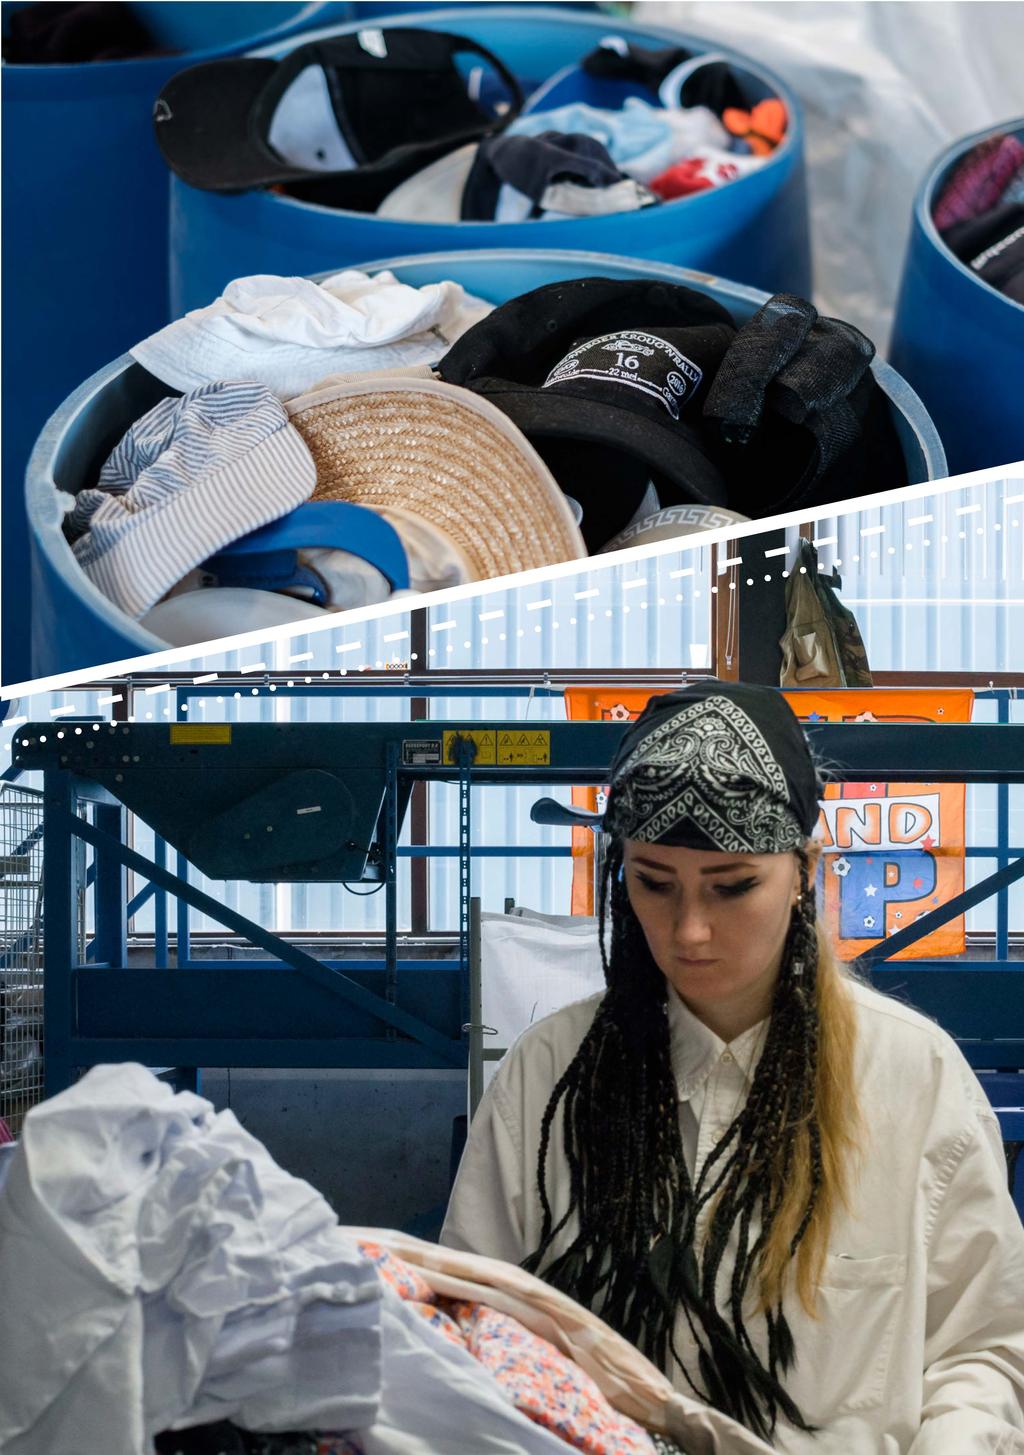
36 Photo credits: Hans van de Woerd for IKcircuLEER.nl

37 Photo credits: Hans van de Woerd for IKcircuLEER.nl
38 Chapter 3: Disposal The Netherlands has (and wants to maintain) a leading position in waste management and recycling (Dubois et al. 2016). Textile waste management plays a role and therefore the disposal phase has been researched in more depth than purchase and use. Four relevant publications regarding the end-of-life stage of textiles were found (FFact 2014; Eureco 2010; Kellermann 2016; Wijnia 2016). These publications focus on different periods in time and on either pre- or post-consumer textile waste. This information was complemented with statistical data from CBS (n.d.), the National Office of Statistics, and Rijkswaterstaat (n.d.), Department of Waterways and Public Works. Moreover, within this project we developed a textile container analysis (section 3.4) and interviews with local sorting actors (section 3.2.2), leading to the data presented in this chapter. 3.1 Pre-consumer waste volumes The issue of pre-consumer waste volumes, obsolete inventory, or clothes that do not reach the consumer, has been a recurrent topic of discussion in the fashion community of the Netherlands. These are finished textile products which are unfit for sale at a regular retail store. A common statement found in literature and lectures is that 30% of the clothes produced never reach the consumer. Matevosyan (2014) for example, relies upon these numbers, of which the source is unknown. In response to this issue, MVO Nederland conducted research in 2016 to obtain a more realistic estimation. The organization found that from the clothing purchased by the Dutch retail sector 4,2% was unsold in If unsold products by producers and wholesalers are included, the overall percentage is 6.5% (Wijnia 2016). This coincides with estimations from interna- 28
39 tional authors, for example, Niinimaki (2011) estimated an unsold inventory between 5 and 10% for Western Europe countries. Most produced goods are sold, however many of them with price reduction across the different steps of the supply chain. MVO Nederland found that 0.9% of items are sold with discount by manufacturers, while at wholesalers discounted products are 12.4 %, and at retailers 31 %. Therefore, the 30% myth may be due to a confusion of discounted items with unsold ones. Production Wholesale Retail Consumption % unsold 1.1% unsold 4.2% unsold 3.8 Hold in inventory 1.3 Outlet 7.6 Commercial re-use 7.7 Charity re-use 0.6 Recycling 0.6 Incineration } 6.5% Total unsold Figure 3.1: Volumes flowing through the Dutch apparel network in 2015 estimated by Wijna on the basis of the Euromonitor's retail volume. Source: Wijna, 2016 The above analysis, which does not include returns, is illustrated in figure 3.1. The qualitative analysis of MVO Nederland s research indicates that clothing companies sell their unsold inventory to sorting companies under strict regulations, to ensure that the items do not enter the black market. Luxury brands often discard their garments for destruction to maintain their brand s name. Charity organization Sympany alone received in 2015 a total amount of 100,000 pieces of apparel and shoes from apparel brands and retailers (Wijnia, 2016). 29
40 3.2 Post-consumer textile waste Volumes of textile waste Post-consumer textile waste includes used products that have been discarded by the consumer after use (e.g. used clothing, footwear, accessories, home textiles, and other household soft goods, disposed within general household waste or collected separately). Available data on post-consumer textile waste indicates that volumes have increased during the period discussed. CBS and Rijkswaterstaat provide data on separately collected textiles (CBS) and textiles found in household waste (Rijkswaterstaat). These volumes are presented in figure 3.2. We note that recent volumes of separately collected textiles should be higher than CBS estimations. See sections and 3.3 for other sources Local collecting and sorting organizations In the context of this research project, we invited all collecting and sorting actors operating in the Netherlands for an interview. However, only three among the main organizations agreed to participate. Together they employ around 330 people (NL) and collect around half of all separately collected textiles in the Netherlands, considering Ffact (2014) estimations for The findings of these interviews have been anonymized and are presented below. The volume of post-consumer textiles collected by our interviewees has grown during the last years. Together they collected 46kton in 2013, 48.2kton in 2014, 54.4kton in 2015 and 53kton in Taking the 90kton of separately collected textile calculated for 2012 by Ffact (2014) as a reference, we estimate a total volume of approximately 92kton collected in 2013, 96kton in 2014, 109kton in 2015, and 107kton in These figures are considerable higher than CBS s estimates (see fig 3.2). However, these volumes may differ according to changes in the actors operating in the sector. Our interviewees may now collect a different portion of the total volume when compared to
41 ** 2014** 2015** Separately collected In HHW Figure 3.2: Total textile waste volume in the Netherlands (kton). Sources: CBS & Rijkswaterstaat. ** provisional. A main issue discussed by interviewees is the economic sustainability of their organizations, which has been challenged by a lower resell value of the items collected during the last decade. They identify a lower quality in the clothing in circulation, which tend to age faster. Moreover, in their eyes the economic crisis affected the disposal behaviour of consumers; clothes were worn longer before being disposed. Lastly, in 2009 new regulations were introduced in order to separate more textile waste from regular household waste. These regulations oblige collectors to take all textile waste with no selection of quality at the source. As a result, they now receive more items that are not suitable for reuse, such as worn-out clothes, underwear, and non-clothing textiles. These issues have influenced the economic value of the items collected during the last decade, with bigger volumes sorted to non-rewearable grades. One respondent indicated that 10 years ago about 80% of the collected items were graded as rewearable, while today this is about 55%. For another sorting actor, rewearable 31
42 grades comprised 50-60% of their offer before the economic crisis, while they are now close to 30%. Charities appear to collect more rewearable quality than other actors. The percentage of actual clothing is slightly higher for them as well; charities reported about 80% and other collecting companies about 65%. This might be due to the association people have with these organizations. In any case, they estimate a decrease in the amount of rewearable clothing within textile waste between 20 and 30% over the past ten years. Rewearable grades are sorted according to quality (A, B, C) and garment type (e.g. men s jeans), based on the specific demand of clients. These grades vary according to company and change over time depending on clients preferences and needs. The main destinations for Dutch rewearable grades are Africa and Eastern Europe. Collectors pay municipalities per kilo collected, although some pay more to place their containers at the best locations. Other collecting costs, including transportation and manpower, are about per kilo. They indicated that they currently get between 0.50 to 4.50 per kilo for rewearable grades. Shoes have a value between 0.50 and The value of non-rewearable grades is generally per kilo with the exception of wool ( per kilo). Clients downcycling post-consumer textiles into cleaning cloth pay them per kilo. For the lowest quality recyclable grades, sorters have to pay to get it processed. None of the collected textiles goes into landfill; this is taken up in the contract with local as well as international clients. For material not suitable for the categories described above, sorters pay for incineration. Some sorters import post-consumer textiles because Dutch rewearable grades are in high international demand, but good quality rewearables are often cheaper abroad. One respondent indicated a cost of per kilo for imported post-consumer textiles. The following countries were mentioned: Italy, France, Austria and Sweden. 32
43 Our interviewees mentioned their preference for above-the-ground containers and manual pick up. They argue that people tend to part more easily from their emotional items in this way. Moreover, above-the-ground containers tend to include less non-textile waste than underground ones, and pollution or damage resulting from underground collection is avoided ** 2014** Items discarded Items bought (GFK) Retail Volume (Euromonitor) Figure 3.3: Average number of clothing items purchased and discarded per capita. Source: CBS, Rijkswaterstaat, container analysis, Euromonitor, GFK Post-consumer clothing and footwear waste On the basis of our interviews with sorting actors and previous studies of textiles included in general household waste by Eureco and Rijkswateerstaat, we estimate that around 80% of all post consumer textiles are clothing and footwear, 20% accounting for home textiles and other materials. Using the average weight per item from our container analysis (see section 3.4), we calculate items of clothing and footwear in textile waste. This is a rough estimation since post-consumer textiles may vary greatly according to 33
44 seasons and region, among other factors. The resulting estimated figures are roughly comparable with items reported by Euromonitor and GFK (retail volume and consumer purchases respectively) in terms of product types included. Figure 3.3 shows the average number of items purchased and discarded (annually per capita), we find GfK s data more consistent with waste volumes than Euromonitor s. The higher numbers for purchases in relation to waste are in line with other European studies (see section 3.5.), which award it to items stored at home ( national wardrobe ). 3.3 Textile waste destinations This section discusses the destiny of Dutch textile waste. Most of the data is based on 2012 figures (Ffact, 2014, see fig 3.4 for an overview). However, the kind of waste collected and its use can vary to a great extent over time based on changes on regulation, consumer awareness, second-hand or recycled material demand for specific products, and other factors. Our interviews with Dutch collectors and sorters aimed at estimating updated figures. Unfortunately, and despite the endorsement received from the branch organization VHT, we could not gather enough information to update these figures. Some collecting and sorting actors did not react to our interview invitation and others could not provide accurate information Textile volume incinerated Disposal of waste via landfill is banned in the Netherlands. Therefore all textile waste that cannot be sorted to other destinations is incinerated for energy recovery. The total amount of textile waste incinerated includes material disposed via household waste and what is collected separately but considered not suitable for reuse or recycling. Ffact estimated that in kton of textiles were found in regular household waste and thus incinerated (FFact 2014, p.8). The same report indicates that in 2012, about 7% of sorted textiles could not be re-used or recycled and was therefore incinerated (FFact 2014, p.14). During our interviews, higher figures were 34
45 mentioned (e.g. 10% for 2015). Therefore, we estimate that the total volume of textiles currently incinerated is slightly higher than that of textiles disposed in general waste (see fig 3.4 for estimates in 2012). Dutch textiles discared 235 Textiles in general household waste 145 Textiles Separately Collected 90 Sorted locally Incinerated 9.6 Recycled locally Procesed Locally 6.6 Clothing re-use locally 28.3 Clothig re-use exports Exports 13.0 Recyclable grades exports 23.0 Exported original 5.4 Non-textile waste recycled or incinerated + Balance difference Figure 3.4: Destiny of textile waste in 2012 according to Ffact, 2014 (Kton). From a household waste analysis carried out in 2009, Eureco (2010) found that 65% of the textile found in regular waste was suitable for reuse or recycling. If disposed properly, these textiles could have been sorted as follows: 35% clothing re-use, 10% linen reuse, 20% recycling and 36% not suitable for product reuse or recycling. Applying these percentages to 2009 Rijkswaterstaat s volumes, we conclude that collecting all 2009 post-consumer waste separately would have prevented the incineration of 95kton of textiles suita- 35
46 ble for reuse and recycling that year. Moreover, 50kton could have been used for clothing reuse, 14kton for linen reuse and 28kton for recycling Rewearable Recyclable Not rewearable or recyclable Shoes Figure 3.5: Potential destination of textiles found in household waste in kton (currently incinerated). Source: Rijkswaterstaat. From 2012 onwards, the annual household waste component study assigned to Eureco by Rijkswaterstaat included subcomponents to the textile category. These subcomponents are not as specific as their 2010 report, but they give a more recent impression of the developments in household waste content. See fig 3.5 for the volumes during calculated on the basis of Rijkswaterstaat/ Eureco percentages. These textiles are currently incinerated, but they could follow the destinations suggested in the figure if they were separately disposed of and collected Textile sorted Textile sorted in the Netherlands includes material collected locally and textile imports (see fig. 3.6). According to sorting actors, this is because Dutch post-consumer textiles are in high international demand, but used clothing of good quality is often cheaper when imported, including transport costs. Local collectors need to pay municipalities and maintain the infrastructure and human resourc- 36
47 es needed for their activity, and this may result in higher costs than buying foreign textiles already collected and sorted elsewhere (see section 3.2.2). Moreover, not all textile collected in the Netherlands is sorted locally; some sorting actors have foreign clients that buy original (unsorted or roughly sorted post-consumer textiles, in which any non-textile items have been removed). This may be more convenient for them, since manual labour is costly in the Netherlands. Figure 3.6: Collection, import and processing of post-consumer textiles (kton) in Source: (FFact 2014) According to Ffact (2014), 23kton were exported original in From the remaining 67kton collected, 5.2kton were non-textile materials and the other 61.6kton were sorted into the reuse, recycling and incineration grades (see fig. 3.4) Textile reused locally Post-consumer clothing suitable for reuse was 56% of the textiles sorted in the Netherlands in 2012 (34.9/61.6kton). 6.6kton of these were sent to Dutch second hand shops (10.6 % of the locally-sorted volume). The rest, 28.3kton, was exported for reuse in different quality categories (Ffact 2014). 37
48 The percentage of collected textiles reused differs per sorter, as they serve different clients. Actors sort per product category, which may vary over time as their clients or demand changes. In the Netherlands, there is one textile sorter that owns its own second-hand shops, this actor has a higher percentage of their sorted product going into re-use locally; approximately 30%. For most of the sorters this in not a profitable pathway, and therefore the amounts locally reused are smaller. Note that we are not including clothing reuse directly exchanged from one consumer to another or via collection at second-hand shops in this report Textile recycled locally 37% of the sorted textiles in the Netherlands (22.6kton) were recycled in kton of these were processed locally to become either cleaning cloth (9.9kton) or recycled fibres (2.9kton) (FFact 2014). The rest were exported for recycling abroad. Sorters sell their products to each other for further sorting and selling, fitting to their clientele or expertise Textile volume exported The total amount of exported post-consumer textiles in 2012 was 109kton; however, this includes post-consumer textiles that were previously imported for sorting purposes. From the 90kton textiles collected in the Netherlands in 2012, 23kton (25.5%) was exported after a first sorting round, to be processed by foreign sorters. During a more selective sorting process, more material was selected for export: 41.6kton, adding up to a total of 64.6kton (71.6%) exported (FFact 2014). Based on consultation with actors in the sorting chain, Ffact calculates the following export volumes and categories after selective sorting: 28.3kton rewearable (68%); 3.3kton recyclable for e.g. cleaning cloth (7,9%) and 9.8kton other recyclable grades (23,7%). 38
Dutch Circular Textiles Platform
 Dutch Circular Textiles Platform Contents Dutch Circular Textiles Platform Supply chain in transition 4 What are circular textiles exactly? And what else? Vision 5 Ambition 5 Strategy 6 Innovation capacity
Clothing longevity and measuring active use
 Summary Report Clothing longevity and measuring active use Results of consumer research providing a quantitative baseline to measure change in clothing ownership and use over time. This will inform work
Collecting Textiles: Make It Work for Your Community
 Collecting Textiles: Make It Work for Your Community Your Name Your Company Name SMART Member Date Today s Definition of Acceptable Textiles to be Recycled Any clothing, household textile or commercial
2. The US Apparel and Footwear Market Size by Personal Consumption Expenditure,
 1 TABLE OF CONTENTS 1. The US Apparel and Footwear Market Introduction 2. The US Apparel and Footwear Market Size by Personal Consumption Expenditure, 2005-2010 3. The US Apparel and Footwear Per Capita
China is simply having their comeback.
 Whoever thinks China is an emerging economy in the world is wrong: China is simply having their comeback. MADE IN CHINA Advice Report Shanti Rossa 25 May 2011 Whoever thinks China is an emerging economy
Case Study Example: Footloose
 Case Study Example: Footloose Footloose: Introduction Duraflex is a German footwear company with annual men s footwear sales of approximately 1.0 billion Euro( ). They have always relied on the boot market
Case study example Footloose
 Case study example Footloose Footloose Introduction Duraflex is a German footwear company with annual men s footwear sales of approximately 1.0 billion Euro( ). They have always relied on the boot market
About the Report. Booming Women Apparel Market in India
 About the Report "Booming Women Apparel Market in India" is the new report by that give a rational analysis on the Indian women apparel industry. This report has been made to help the client in analyzing
INDIAN APPAREL MARKET OUTLOOK
 INDIAN APPAREL MARKET OUTLOOK Market Size by Apparel Type, Gender and Region Trends and Forecast Till 2021 www.fibre2fashion.com 1 ABOUT US Fibre2fashion.com was established in 2000 and is owned and promoted
States Charging Ahead With Textile Recovery
 States Charging Ahead With Textile Recovery Jackie King SMART Executive Director 443-640-1050 x105 jackie@kingmgmt.org www.smartasn.org January 6, 2016 Today s Definition of Acceptable Textiles to be Recycled
Consumer and Market Insights: Skincare Market in France. CT0027IS Sample Pages November 2014
 Consumer and Market Insights: Skincare Market in France CT0027IS Sample Pages November 2014 Example table of contents Introduction Category classifications Demographic definitions Summary methodology Market
Sector: Textile and Clothing. Keywords: Bulgaria, Sofia, Furniture, Clothing and Design sector, Clothing and Textile sector.
 MINISTRY OF FOREIGN AFFAIRS OF DENMARK THE TRADE COUNCIL TEXTILE AND CLOTHING SECTOR BULGARIA Sector: Textile and Clothing Prepared by the Danish embassy in Sofia May 2012 Keywords: Bulgaria, Sofia, Furniture,
Management Report Our everyday companions. Study: the market for jewellery, watches and accessories in Germany
 Management Report Our everyday companions Study: the market for jewellery, watches and accessories in Germany 1 Executive Summary The market for jewellery, watches and personal accessories is continuing
2008 in figures Year in brief
 Dear shareholders, The year 2008 has been an exciting, eventful but also challenging year. The global economic situation changed drastically, which also affected H&M. Despite this, our strong expansion
Research Paper No.2. Representation of Female Artists in Britain in 2016
 Research Paper No.2 Representation of Female Artists in Britain in 2016 The following report was commissioned by the Freelands Foundation. The intention of the report is to provide up-to-date data on the
State of. Reuse. Report
 2018 State of Reuse Report Style Comes Full Circle pg. 3 Introduction Since commissioning the inaugural State of Reuse Report in 2016, we have seen variations in consumer behavior across the reuse cycle
May Sustainable Strategies & Solutions. Introduction Into Textile Waste
 May 2017 Sustainable Strategies & Solutions Introduction Into Textile Waste What are Textiles? A type of material composed of natural or synthetic fibers. A type of cloth. Textiles are often associated
State of. Reuse. Report
 2018 State of Reuse Report Style Comes Full Circle pg. 1 Introduction Since commissioning the inaugural State of Reuse Report in 2016, we have seen variations in consumer behavior across the reuse cycle
NATIONAL TEXTILE AND APPAREL RECOVERY INITIATIVE
 NATIONAL TEXTILE AND APPAREL RECOVERY INITIATIVE KEY FACTS Globally, we produce 2.1 BT of waste per year, more than 1.6 times earth s long-term production capacity. At this rate, we will generate 62% more
SALES (EURO 7.94 BLN) AND TRADE SURPLUS (EURO 2.3 BLN) FOR
 AND TRADE SURPLUS (EURO 2.3 BLN) FOR") SALES (EURO 7.94 BLN) AND TRADE SURPLUS (EURO 2.3 BLN) FOR ITALIAN TEXTILES ARE UP 1.3 AND 0.4, RESPECTIVELY. FOR THE SECOND CONSECUTIVE YEAR EMPLOYMENT HOLDS STEADY. CHINA WITH HONG KONG - REPEATS AS
SALES (EURO 7.94 BLN) AND TRADE SURPLUS (EURO 2.3 BLN) FOR ITALIAN TEXTILES ARE UP 1.3 AND 0.4, RESPECTIVELY. FOR THE SECOND CONSECUTIVE YEAR EMPLOYMENT HOLDS STEADY. CHINA WITH HONG KONG - REPEATS AS
Title Page Textile Waste in Skagit County Program Proposal. Emily Cone and Whitaker Jamieson. WWU Office of Sustainability
 Title Page Textile Waste in Skagit County Program Proposal Emily Cone and Whitaker Jamieson WWU Office of Sustainability 1 Table of Contents Title Page 1 Table of Contents 2 Executive Summary 3 Statement
NCV ANNUAL REPORT The Dutch cosmetics market in 2016
 NCV ANNUAL REPORT 2016 The Dutch cosmetics market in 2016 The diversity of cosmetics sales channels has increased significantly in recent years. The consumer has more and more opportunities to buy cosmetics.
Careers and Income Opportunities
 Careers and Income Opportunities http://www.fashion-schools.org/fashion-designer.htm Fashion Designer Fashion designers conceptualize and create new clothing and accessory designs. They analyze fashion
CBI Trade Statistics: Jewellery
 CBI Trade Statistics: Jewellery Introduction Despite the economic crisis, the European jewellery market has consistently shown great opportunities for importers from Developing Countries. While countries
Gathering Momentum. Trends and Prospects for Fine Merino Wool. Balmoral Sire Evaluation Group 2016 Field Day 8 th April 2016
 Gathering Momentum Trends and Prospects for Fine Merino Wool Chris Wilcox Chairman, Market Intelligence Committee International Wool Textile Organisation Executive Director, National Council of Wool Selling
Indian Cotton Textile Consumption in the Post-MFA Era
 Indian Cotton Textile Consumption in the Post-MFA Era 2005 Agricultural Outlook Forum Cotton and Fibers Outlook 25/February 2005 by David B. Collins Assistant Executive Director - CCI Expectations for
CHAPTER Introduction
 CHAPTER 1 1. Introduction This section will talk about the background of this research, the problem statement and the aim and purpose of this research. Also, a few literature review, the scope and method
INDUSTRY OVERVIEW. No. of establishments 117 (manufacturing) March ,257 (import and export) December 2000
 March ,257 (import and export) December 2000") The information provided in this section is derived from various public and private publications. This information has not been prepared or independently verified by the Company, the Vendors, the Directors,
The information provided in this section is derived from various public and private publications. This information has not been prepared or independently verified by the Company, the Vendors, the Directors,
Current State of Textile Recycling. UNIDO Circular Economy Conference
 UNIDO Circular Economy Conference Martin Böschen CEO TEXAID AG / Member of BIR-Textile Board Vienna, 15th November 2018 The textile industry follows a linear model Lifecyle ends at the consumer end of
WEST HUNGARY TEXTIL KFT.
 WEST HUNGARY TEXTIL KFT. ABOUT OUR COMPANY AND PRODUCTS Catalogue with photos More than 20 years for our customers Our company has been trading with used clothes and shoes since 1994. The sorting factory
Growth and Changing Directions of Indian Textile Exports in the aftermath of the WTO
 Growth and Changing Directions of Indian Textile Exports in the aftermath of the WTO Abstract A.M.Sheela Associate Professor D.Raja Jebasingh Asst. Professor PG & Research Department of Commerce, St.Josephs'
Fashion Pricing and Technology. Back to Table of Contents
 Fashion Pricing and Technology Back to Table of Contents Chapter 11 Fashion Pricing and Technology Fashion Pricing and Technology Pricing and Credit Using Technology 2 Chapter Objectives Describe the five
Guidance on design for longevity casualwear
 Guidance on design for longevity casualwear Extending the lifespan and use of garments is one of the most significant ways of reducing the environmental impact of clothing Product overview Casualwear includes
The Use of 3D Anthropometric Data for Morphotype Analysis to Improve Fit and Grading Techniques The Results
 The Use of 3D Anthropometric Data for Morphotype Analysis to Improve Fit and Grading Techniques The Results Abstract Joris COOLS 1*, Alexandra DE RAEVE 1, Peter VAN RANSBEECK 2, Simona VASILE 1, Benjamin
Milwaukee Textile Recycling. Clothing Drive Event Planning Packet
 Clothing Drive Event Planning Packet A division of CTC Supplies 3845 N. Bremen St. Milwaukee, WI 53212 Dear Fund-Seeker, Thank you for considering for your fundraising needs. We are confident that you
US Denim Jeans Market Report
 US Denim Jeans Market Report ----------------------------------------- 2015 Executive Summary Denim has become a wardrobe staple for the comfort it offers and above all for being one of the best clothing
Cosmetic Industry in Figures
 9 Cosmetic Industry in Figures Whilst the stark statistics show as a rather unspectacular year for the cosmetics industry, we started to see the uncertain economic future and consequently shopping behaviour
Current cotton fiber market in Russia
 Current cotton fiber market in Russia By Mr. Sechko M.S., President of «Russian Cotton Association» NP One of the priorities of economic growth and national safety of the country in developing market model
ALASKA GROSS STATE PRODUCT
 ALASKA GROSS STATE PRODUCT 1961-1998 by Scott Goldsmith Professor of Economics prepared for Alaska Department of Commerce and Economic Development June 1999 Institute of Social and Economic Research University
ENVIRONMENTALLY SUSTAINABLE APPAREL ACQUISITION AND DISPOSAL BEHAVIOURS AMONG SLOVENIAN CONSUMERS
 ENVIRONMENTALLY SUSTAINABLE APPAREL ACQUISITION AND DISPOSAL BEHAVIOURS AMONG SLOVENIAN CONSUMERS Zala Žurga, Aleš Hladnik, Petra Forte Tavčer University of Ljubljana, Faculty of Natural Sciences and Engineering,
Mehdi Mahbub CEO & Chief Consultant, Best Sourcing Founder, RMG Bangladesh GLOBAL TRENDS IN THE GARMENT SECTOR AND OPPORTUNITIES FOR BANGLADESH
 GLOBAL TRENDS IN THE GARMENT SECTOR AND OPPORTUNITIES FOR BANGLADESH TECHNOLOGICAL CHANGES AND INNOVATIONS IN THE WORLD BANGLADESH READYMADE GARMENT INDUSTRY, the 2 nd largest apparel exporter of the world:
COMPETENCIES IN CLOTHING AND TEXTILES NEEDED BY BEGINNING FAMILY AND CONSUMER SCIENCES TEACHERS
 Journal of Family and Consumer Sciences Education, Vol. 20, No. 1, Spring/Summer, 2002 COMPETENCIES IN CLOTHING AND TEXTILES NEEDED BY BEGINNING FAMILY AND CONSUMER SCIENCES TEACHERS Cheryl L. Lee, Appalachian
Course Bachelor of Fashion Design. Course Code BFD16. Location City Campus, St Kilda Road
 Course Bachelor of Fashion Design Course Code BFD16 Location City Campus, St Kilda Road Contact Julie Wright, Course Leader: julie.c.wright @holmesglen.edu.au PUBLIC Holmesglen: bh 19-Dec-2016 Q:\Projects\Higher
What really happens to old clothes dropped in those instore recycling bins
 What really happens to old clothes dropped in those instore recycling bins cbc.ca/news/business/clothes-recycling-marketplace-1.4493490 If you've been to a mall recently you might have spotted something
6. Leather Footwear. Fig. 1 Japan s leather footwear imports
 II 6. Leather Footwear Leather Footwear 1. Definition of Category This category covers leather footwear including boots, but excluding athletic shoes and slippers. All leather footwear is subject to tariff
Secondhand Clothing Recovery, Recycle & Reuse Industry
 Secondhand Clothing Recovery, Recycle & Reuse Industry CTR s Mission: Create awareness about keeping what we wear out of landfills in order to divert significant quantities of pctw from national and local
Higher National Unit Specification. General information for centres. Fashion: Commercial Design. Unit code: F18W 34
 Higher National Unit Specification General information for centres Unit title: Fashion: Commercial Design Unit code: F18W 34 Unit purpose: This Unit enables candidates to demonstrate a logical and creative
10 TRUTHS ABOUT ITALIAN COMPETITIVENESS FOCUS ON THE BOATBUILDING SECTOR
 10 TRUTHS ABOUT ITALIAN FOCUS ON THE BOATBUILDING SECTOR Italy is slowly pulling out of the economic crisis. Yet, the Country has to deal with problems that the global stagnation has worsened, but that
This is a licensed product of Ken Research and should not be copied
 1 TABLE OF CONTENTS 1. UAE Textile Industry Introduction 2. UAE Textile Industry Market Size, 2007-2011 2.1. By Output, 2007-2011 2.2. By Revenue, 2006-2011 3. UAE Textile Industry Segmentation 3.1. By
Tips for proposers. Cécile Huet, PhD Deputy Head of Unit A1 Robotics & AI European Commission. Robotics Brokerage event 5 Dec Cécile Huet 1
 Tips for proposers Cécile Huet, PhD Deputy Head of Unit A1 Robotics & AI European Commission Robotics Brokerage event 5 Dec. 2016 Cécile Huet 1 What are you looking for? MAXIMISE IMPACT OF PROGRAMME on
Fashion Designers
 http://www.bls.gov/oco/ocos291.htm Fashion Designers * Nature of the Work * Training, Other Qualifications, and Advancement * Employment * Job Outlook * Projections Data * Earnings * OES Data * Related
Business Studies BUSS1 (JUN14BUSS101) General Certificate of Education Advanced Subsidiary Examination June Planning and Financing a Business
 General Certificate of Education Advanced Subsidiary Examination June Planning and Financing a Business") Centre Number Surname Candidate Number For Examiner s Use Other Names Candidate Signature Examiner s Initials Question Mark Business Studies General Certificate of Education Advanced Subsidiary Examination
Centre Number Surname Candidate Number For Examiner s Use Other Names Candidate Signature Examiner s Initials Question Mark Business Studies General Certificate of Education Advanced Subsidiary Examination
The Future of the Male Toiletries Market in the UAE to 2018
 673 1. The Future of the Male Toiletries Market in the UAE to 2018 Reference Code: CT0246MR Report Price: US$ 875 (Single Copy) www.canadean-winesandspirits.com Summary is the result of Canadean s extensive
2017 Chinese Home Textile Industry Development. and the Trend Analysis
 Sources: http://www.chinaidr.com/tradenews/2017-12/116930.html 2017 Chinese Home Textile Industry Development and the Trend Analysis 1. The home textile industry is picking up at an accelerating pace Affected
Clothing & Footwear Retailing in Russia Market Summary & Forecasts
 Clothing & Footwear Retailing in Russia Market Summary & Forecasts Comprehensive overview of the market, consumer, and competitive context, with retail sales value and forecasts to 2018 Report Code: RT0076SR
Subject : Apparel Merchandising. Unit 1 Introduction to apparel merchandising. Quadrant 1 e-text
 Subject : Apparel Merchandising Unit 1 Introduction to apparel merchandising Quadrant 1 e-text Learning Objectives The learning objectives of this unit are to: Describe the challenges in apparel business.
Global Handbags Market
 Global Handbags Market ----------------------------------------------------- 2014 Executive Summary Handbags and accessories are among the fastest growing segments in the overall luxury goods industry.
China Textile and Apparel Production and Sales Statistics, Jul. 2014
 China Textile and Apparel Production and Sales Statistics, 2013-2014 Jul. 2014 STUDY GOAL AND OBJECTIVES This report provides the industry executives with strategically significant competitor information,
Clothing insulation From Wikipedia, the free encyclopedia
 Page 1 of 9 Clothing insulation From Wikipedia, the free encyclopedia Clothing insulation is the thermal insulation provided by clothing. [1][2] Even if the main role of clothing is to protect from the
Guidance on design for longevity underwear
 Guidance on design for longevity underwear Extending the lifespan and use of garments is one of the most significant ways of reducing the environmental impact of clothing Product overview Underwear includes
Powers of Persuasion Writing opinion pieces, supporting a point of view with reasons and information
 We re Recycling Textiles Powers of Persuasion Writing opinion pieces, supporting a point of view with reasons and information Share facts from the Textile Recycling Fact Sheet and the infographic mini
Catalogue with photos, 2019 Summer ABOUT OUR COMPANY AND PRODUCTS
 Catalogue with photos, 2019 Summer ABOUT OUR COMPANY AND PRODUCTS The aim of this brochure is to draw your attention to the products of our company. We wanted to create a representative product-line that
St. Pauly Clothing Drop Off Shed
 St. Pauly Clothing Drop Off Shed St. Pauly currently has 268 sheds with community groups in Upsate NY. No one has ever asked to remove one. Hello, My name is Zach, and I have worked to expand St. Pauly
Published in: Proceedings of the 11th International Conference on Environmental Ergonomics
 Using 3D whole body scanning to determine clothing area factor Gao, Chuansi; Kuklane, Kalev; Holmér, Ingvar Published in: Proceedings of the 11th International Conference on Environmental Ergonomics 2005
IRI Pulse Report Personal Care
 IRI Pulse Report Personal Care Welcome to the Pulse Q3 2013 edition for personal care. We hope you find it useful. Please do not hesitate to contact us if you have any questions or comments at EU.Marketing@IRIworldwide.com.
FACTS & NUMBERS 2016
 FACTS & NUMBERS 2016 STATISTICAL ANALYSIS 2015 Portugal exported 79 million pairs of shoes, valued at 1 865 million euros. 2015 was the sixth consecutive year with growth in footwear exports Exports have
Comparison of Women s Sizes from SizeUSA and ASTM D Sizing Standard with Focus on the Potential for Mass Customization
 Comparison of Women s Sizes from SizeUSA and ASTM D5585-11 Sizing Standard with Focus on the Potential for Mass Customization Siming Guo Ph.D. Program in Textile Technology Management College of Textiles
Statistical Analysis Of Chinese Urban Residents Clothing Consumption
 Volume 4, Issue 2, Fall2004 Statistical Analysis Of Chinese Urban Residents Clothing Consumption Jun Li, Xuchu Jin, and Yan Liu Fashion Institute, Dong Hua University, Shanghai, P. R. China ABSTRACT Clothing
Shopping and Us (1) Chapter 1
 Chapter 1") Shopping and Us (1) Did you know...? Read the following statements. Mark each one as Positive (+), Negative ( ) or Neutral (n). Then, circle the facts that surprised you. Compare your responses with your
Shopping and Us (1) Did you know...? Read the following statements. Mark each one as Positive (+), Negative ( ) or Neutral (n). Then, circle the facts that surprised you. Compare your responses with your
A STUDY OF DIAMOND TRADE VIS.-À-VIS. GEMS AND JEWELLERY TRADE AND TOTAL MERCHANDISE TRADE OF INDIA DURING THE LAST DECADE
 A STUDY OF DIAMOND TRADE VIS.-À-VIS. GEMS AND JEWELLERY TRADE AND TOTAL MERCHANDISE TRADE OF INDIA DURING THE LAST DECADE Dr. Neelam Arora I/C Principal and Head of Department, Lala Lajpatrai College of
Thailand s Jewelry Industry Overview 2016
 Thailand s Jewelry Industry Overview 2016 Jewelry is one of Thailand s major export products in gem and jewelry category and holds the second place after unwrought or semi-manufactured gold in terms of
STATISTICAL ANALYSIS 2015
 FACTS & NUMBERS STATISTICAL ANALYSIS 2015 Portugal exported 79 million pairs of shoes, valued at 1 865 million euros. 2015 was the sixth consecutive year with footwea exports growth Exports grew by 1.1%
CONsCIOUs ACTIONs Highlights 2012
 CONSCIOUS ACTIONS Highlights 2012 Welcome to H&M s CONSCIOUS ACTIONS Highlights 2012 At H&M, we think of sustainability as a word of action. It s an ongoing journey full of heart, drive and passion with
Market Analysis. Summary
 Market Analysis Summary Jewelry manufacturing in the U.S. has seen sharp declines in recent years due to strong foreign competition. Many developing countries are in a good position to provide products
Thank you for your interest in hosting a clothing drive in support of Dress for Success Vancouver.
 Thank you for your interest in hosting a clothing drive in support of Dress for Success Vancouver. Professional attire provided to Dress for Success Vancouver (www.dressforsuccess.org/vancouver) will be
Investment Opportunities in the Design Industry in Taiwan
 Investment Opportunities in the Design Industry in Taiwan I. Industry Definition and Scope The Cultural and Creative Industry Policy in Taiwan has delineated the domestic design service industry into three
IMAGES Business of Fashion
 IMAGES Business of Fashion THE DENIM ISSUE Evolving with changing times With very low per capita consumption currently, and increasing acceptance of denim as a major fashion choice, the denim sector is
APPENDIX I. ANALYSIS OF THE CURRENT STATE
 APPENDICES APPENDIX I. ANALYSIS OF THE CURRENT STATE 1. STATE AND DEVELOPMENT OF SECTOR MANUFACTURE OF WEARING APPAREL, INCLUDING LEATHER APPAREL, TANNING OF LEATHER IN BULGARIA The analysis of the condition
Change your Clothes, Change the world
 Change your Clothes, Change the world Our Mission Since 2000, Recycle for Change has been dedicated to helping those most affected by global climate change and poverty worldwide. Recycle for Change has
Apparel, Textiles & Merchandising. Business of Fashion. Bachelor of Science
 Bachelor of Science Apparel, Textiles & Merchandising Business of Fashion Major or Minor in Apparel, Textiles & Merchandising :: Apparel Design Minor We nurture tomorrow s fashion leaders and develop broad-based
Master's Research/Creative Project Four Elective credits 4
 FASHION First offered fall 2010 Curriculum Master of Arts (MA) Degree requirements Course title Credits Master's Research/Creative Project Milestone Four Elective credits 4 Course code Course title Credits
Chi Square Goodness of fit, Independence, and Homogeneity May 07, 2014
 Example 1 Goodness of Fit test Does your zodiac sign determine how successful you will be later in life? Fortune magazine collected the zodiac signs of 256 heads of the largest 400 companies. Here are
A Regional Perspective: Opportunities for Textile Reuse, Rewear, and Recycling
 A Regional Perspective: Opportunities for Textile Reuse, Rewear, and Recycling 1 2 Support development of collection/processing infrastructure for recycling end markets for recyclable & reusable materials/products
Mr. Ira Livingston Managing Partner: LIC LLC for Cotton Incorporated. VI BRAZILIAN COTTON CONGRESS 15 August 2007
 Mr. Ira Livingston Managing Partner: LIC LLC for Cotton Incorporated VI BRAZILIAN COTTON CONGRESS 15 August 2007 Presentation: Cotton in Brazil Brazilian Consumers Cotton Incorporated History Moving Forward
ODLO International AG has nearly all its products certified according to OEKO-TEX Standard 100
 Press information Pure passion for sport ODLO International AG has nearly all its products certified according to OEKO-TEX Standard 100 14-Jan-2013 2098-EN As a leading manufacturer of all types of functional
Latvian Textile and Clothing Industry. January 2006 Jadviga Neimane, Project Manager
 Latvian Textile and Clothing Industry January 2006 Jadviga Neimane, Project Manager Output Value and Employment Output Value of textiles and clothing ( 000 LVL)* Number of employees in the textiles and
Cost of Production. {Earth Systems & Resources
 Cost of Production {Earth Systems & Resources Objectives Students will: Explain various factors that might contribute to a company s sourcing decisions Describe real-life working conditions Weigh the pros
EL DORADO UNION HIGH SCHOOL DISTRICT EDUCATIONAL SERVICES Course of Study Information Page. History English
 Course of Study Information Page COURSE TITLE Advanced Fashion DISTRICT COURSE NUMBER 0562 Rationale: Course Description that will be in the Course Directory: How Does this Course align with or meet State
Global Underwear Market 2014
 Provided by RESEARCH ON INTERNATIONAL MARKETS Global Underwear Market 2014 SAMPLE REPORT August 2014 Photo Credit Michaeljung Dreamstime.com PREFACE Market reports by ystats.com inform top managers about
Resource for Teachers
 Resource for Teachers Understanding verbs used in P/M/D grade descriptors AM20530 Level 2 Certificate in Hairdressing and Beauty Therapy (VRQ) Resource for Teachers AM20530 - Level 2 Certificate in Hairdressing
The 14th Shanghai International Hosiery Purchasing Expo
 The 14th Shanghai International Hosiery Purchasing Expo 2019.3.20-22 Shanghai World Expo Exhibition & Convention Center www.chpe.com.cn Export Orientation High-end Domestic Trade Gather Original Design
100% LEADING THE CHANGE
 100% LEADING THE CHANGE OVERVIEW VISION & STRATEGY 100% CIRCULAR & RENEWABLE 100% FAIR & EQUAL STANDARDS & POLICIES H&M GROUP SUSTAINABILITY REPORT 2017 16 OF 100 H&M. KEY FACTS & FIGURES / EXPLAINED /
Guidance on design for longevity sportswear
 Guidance on design for longevity sportswear Extending the lifespan and use of garments is one of the most significant ways of reducing the environmental impact of clothing Product overview Sportswear includes
Kadgee Clothing. Scenario and requirement
 Kadgee Clothing Scenario and requirement Overview of clothing manufacturing in Europe Since the 1960 s there has been a decline in the number of UK and European clothing manufacturers due to competition
Men s Underwear Prices Have Increased
 In advance of Fung Global Retail & Technology s Breakfast with The Disruptors event, held at the PROJECT New York menswear conference on July 18, Fung Global Retail & Technology and First Insight partnered
IWTO Market Information Review and Outlook
 11 Review and Outlook With a steady economic recovery underway in the major wool-consuming countries of the European Union and the United States, the 2014/15 season saw a steady improvement over 2013/14,
REPUBLIC OF RWANDA MINISTRY OF TRADE, INDUSTRY AND EAC AFFAIRS
 REPUBLIC OF RWANDA MINISTRY OF TRADE, INDUSTRY AND EAC AFFAIRS RESPONSE TO THE REQUEST FOR COMMENTS AND NOTICE OF PUBLIC HEARING CONCERNING AN OUT- OF- CYCLE REVIEW OF RWANDA S ELIGIBILITY FOR BENEFITS
Italy. Eyewear Key Figures 2015
 Italy Eyewear Key Figures 2015 1 General information 2015 Population: 60.656.125 (-0,2% vs 2014) GDP per capita: 26.840 (+2% vs 2014) Population over-40: 55% of population Population over-65: 22% of population
The Lesotho Textile and Garment Industry Opportunities
 The Lesotho Textile and Garment Industry Opportunities Contents 1 Overview of Lesotho 2 Profile of the Textile and Garment Industry 3 Investment Opportunities 4 Incentives and Investment Services LESOTHO
Pakistan Leather Garments Sector ( )
") 2018 Trade Analysis Series Pakistan Leather Garments Sector (2017-18) Trade Analysis Series Turn Potential into Profit! Ministry of Industries and Production Government of Pakistan www.smeda.org.pk UAN:
2018 Trade Analysis Series Pakistan Leather Garments Sector (2017-18) Trade Analysis Series Turn Potential into Profit! Ministry of Industries and Production Government of Pakistan www.smeda.org.pk UAN: