Fast fashion, which carries high-end designs to the mass market at affordable
|
|
|
- Lucinda Small
- 6 years ago
- Views:
Transcription
1 JUNG, SOJIN, Ph.D. Slow Fashion: Understanding Potential Consumers and Creating Customer Value for Increasing Purchase Intention and Willingness to Pay a Price Premium. (2014) Directed by Dr. Byoungho Jin. 191 pp. Fast fashion, which carries high-end designs to the mass market at affordable price ranges quickly, has gained success. However, fast fashion is often criticized for spurring people to buy multiple clothes at once with little perceived value, and discard them quickly. As an antithesis of fast fashion, the apparel industry has been increasingly interested in slow fashion. However, there has been lack of theoretical understanding of slow fashion. This dissertation is aimed at investigating the slow fashion movement by identifying potential slow fashion consumers (Study I), and ways to create customer values toward slow fashion products to increase purchase intention and willingness to pay a price premium (Study II). By Churchill s (1978) scale item generation and purification procedures, a preliminary study found 15 items that accounted for five dimensions of consumer orientation to slow fashion: Equity, Authenticity, Functionality, Localism and Exclusivity. These dimensions elucidated that slow fashion is related to, but distinctive from existing environmental and social sustainability concepts. Targeting nationwide U.S. consumers, respondents of this study were selected by the quota sampling method with consideration to age, gender and geographical location of respondents. The online survey URL was sent to a total of 1,000 respondents, and the final 221 completed responses were analyzed.
2 In Study I, consumers were classified into four consumer groups based on the five orientations to slow fashion: High involvement in slow fashion group, traditional group, exclusivity oriented group, and low involvement in slow fashion group. To understand characteristics of each group, the groups were profiled by the Schwartz value, apparel consumption behaviors and demographic variables. Based on their profiles, subjects of each group except for those in the low involvement group were evaluated to be potential slow fashion consumers. Three groups were found to be different by their orientation to slow fashion, personal values, consumption behaviors, etc.: Different marketing strategies were suggested to address the needs of each group effectively. On the basis of the customer value creation framework, Study II tested how each dimension of consumer orientation to slow fashion increased perceived customer value on slow fashion products, which in turn positively influences consumer s purchase intention and willingness to pay a price premium. The results of the structural equation modeling revealed that consumer orientation toward Exclusivity enhances perceived customer value on slow fashion products. Moreover, the perceived customer value increased the consumer s purchase intention and willingness to pay a price premium. This study extended academic understanding of slow fashion through empirical identification of slow fashion dimensions, profiling of potential slow fashion consumers and confirming factors related to creating customer values and its consequences. In addition to detailed marketing implications, this study further provided suggestions for the U.S. government policy and consumer education program to achieve sustainability and foster the U.S. domestic apparel industry.
3 SLOW FASHION: UNDERSTANDING POTENTIAL CONSUMERS AND CREATING CUSTOMER VALUE FOR INCREASING PURCHASE INTENTION AND WILLINGNESS TO PAY A PRICE PREMIUM by Sojin Jung A Dissertation Submitted to the Faculty of The Graduate School at The University of North Carolina at Greensboro in Partial Fulfillment of the Requirements for the Degree Doctor of Philosophy Greensboro 2014 Approved by Dr. Byoungho Jin Committee Chair
4 APPROVAL PAGE This dissertation written by SOJIN JUNG has been approved by the following committee of the Faculty of The Graduate School at The University of North Carolina at Greensboro. Committee Chair Dr. Byoungho Jin Committee Members Dr. Nancy Hodges Dr. Jennifer Yurchisin Dr. Erick Byrd May 30, 2014 Date of Acceptance by Committee May 30, 2014 Date of Final Oral Examination ii
5 ACKNOWLEDGEMENTS I would like to express my deep appreciation to the people who have brought my dissertation to completion. First of all, I would like to thank my advisor, Dr. Byoungho Jin, for her guidance, support and encouragement for not only completion of this dissertation but also completion of this program. Through her insights and passion, I have found a clear and strong vision to go forward as an academician. I would also like to thank my committee members, Dr. Nancy Hodges, Dr. Jennifer Yurchisin and Dr. Erick Byrd. They have given me valuable comments and suggestions in this pursuit. Their assistance has enabled me to complete my dissertation. In addition, beyond the dissertation, I would never have been able to finish the Ph.D. program without support from CARS department, all faculties, and my friends. Finally, to the biggest supporter Jihun, Clara, and my parents, I give my sincere appreciation for your endless love and patience. Thank you for always believing in my decision. You have motivated me to pursue the completion of the Ph.D. program successfully. I love you so much. This dissertation is dedicated to my family with all my heart. iii
6 TABLE OF CONTENTS iv Page LIST OF TABLES... viii LIST OF FIGURES...x CHAPTER I. INTRODUCTION...1 Statement of Research Background...1 Fast Fashion...1 Sustainable Movements of the Apparel Industry...2 Slow Fashion...4 Statement of Research Gaps...6 Research Objectives...9 Contributions of the Study...10 Limitations of the Study...11 Definitions of Key Terms...12 Organization of the Dissertation...14 II. LITERATURE REVIEW...15 Sustainability...15 Concept of Sustainability...15 Sustainability in the Apparel Industry...18 Slow Fashion...24 Background: Antithesis of Fast Fashion...26 Concept of Slow Fashion...28 Theoretical Foundations...36 Schwartz Values...36 Customer Value Creation Framework...43 Proposed Conceptual Frameworks...51 Preliminary Study. Identifying Dimensions of Consumer Orientation to Slow Fashion...51 Scale Item Generation...52 Scale Item Purification...53 Study I. Profiling Potential Slow Fashion Consumers...64
7 Study II. Structural Equation Modeling to Test Hypothetical Relationships...65 Influences of Slow Fashion Orientations on Perceived Customer Value...66 Influence of Perceived Customer Value on Purchase Intention and Willingness to Pay a Price Premium...71 Summary...72 III. RESEARCH METHODOLOGY...74 Sample and Data Collection...74 Survey Design and Instrument Development...76 Consumer Orientation to Slow Fashion...78 Environmental Apparel Consumption...78 Socially Responsible Consumption...79 Schwartz Values...79 Apparel Consumption Behaviors...79 Perceived Customer Values toward Slow Fashion Products...80 Purchase Intention...81 Willingness to Pay a Price Premium...82 Acceptable Price Premium...82 Demographics...82 Pre-test...83 Statistical Analysis...83 Summary...85 IV. DATA ANALYSIS AND RESULTS...86 Sample Description and Non-response Bias Tests...86 Preliminary Analysis...90 Diagnostics of Normality and Outliers...90 Confirmatory Factor Analysis on Major Constructs...91 Validating Dimensions of Consumer Orientation to Slow Fashion...98 Validation...98 Relationships among Slow Fashion, Environmental Sustainability and Social Sustainability Study I. Profiling Potential Slow Fashion Consumers Group Identification v
8 Predictive Validity of the Identified Groups as Potential Slow Fashion Consumers Comparison of Groups on Personal Values Comparison of Groups on Apparel Consumption Behaviors Comparison of Groups on Demographic Variables Study II. Structural Equation Modeling to Test Hypothetical Relationships Measurement Model Analysis Structural Model Analysis Summary V. CONCLUSIONS Summary of Findings Discussion of Major Findings What Is Slow Fashion? Who Will Potential Slow Fashion Consumers Be? How Do Slow Fashion Brands Encourage Consumers to Buy and Pay More for Slow Fashion Products? Implications Theoretical Implications Practical Implications Limitations and Suggestions for Future Research REFERENCES APPENDIX A. SURVEY QUESTIONNAIRE APPENDIX B. IMAGES OF FAST FASHION BRANDS APPENDIX C. IMAGES OF SLOW FASHION BRANDS APPENDIX D. APPROVAL OF INSTITUTIONAL REVIEW BOARD: A STUDENT SAMPLE SURVEY APPENDIX E. APPROVAL OF INSTITUTIONAL REVIEW BOARD: A NON-STUDENT SAMPLE SURVEY APPENDIX F. APPROVAL OF INSTITUTIONAL REVIEW BOARD: A NATIONWIDE SAMPLE SURVEY vi
9 APPENDIX G. DENDROGRAM BY THE HIERARCHICAL CLUSTER ANALYSIS vii
10 LIST OF TABLES viii Page Table 1. General Tendencies of Slow and Fast Fashion...31 Table 2. Differences between Slow Fashion Consumers and Fast Fashion Consumers...35 Table 3. Schwartz Value Types...39 Table 4. Shared Motivations of Adjacent Schwartz Value Types...41 Table 5. A Comparison between Customer Satisfaction and Customer Value...47 Table 6. Three Approaches for Customer Value Creation...49 Table 7. Exploratory Factor Analysis of Consumer Orientation to Slow Fashion: A Student Sample (N=121)...57 Table 8. Confirmatory Factor Analysis of Consumer Orientation to Slow Fashion: A Student Sample (N=121)...58 Table 9. Acceptable Thresholds for Model Fit Indices (N< 250)...59 Table 10. Mean, Standard Deviation, and Correlations of Consumer Orientation to Slow Fashion: A Student Sample (N=121)...59 Table 11. Sample Descriptions: A Non-student Sample (N=122)...61 Table 12. Confirmatory Factor Analysis of Consumer Orientation to Slow Fashion: A Non-student Sample (N=122)...63 Table 13. Mean, Standard Deviation, and Correlations of Consumer Orientation to Slow Fashion: A Non-student Sample (N=122)...64 Table 14. Measurement Items, Scales, and the Sources...77 Table 15. Major Statistical Techniques...85 Table 16. Sample Description and Non-response Test Results...89 Table 17. Composition Comparisons between the Sample and U.S. Census...90
11 Table 18. Confirmatory Factor Analysis of Environmental Apparel Consumption...92 Table 19. Confirmatory Factor Analysis of Socially Responsible Consumption...93 Table 20. Confirmatory Factor Analysis of Schwartz Values...95 Table 21. Confirmatory Factor Analysis of Perceived Customer Values toward Slow Fashion Products...98 Table 22. Confirmatory Factor Analysis of Consumer Orientation to Slow Fashion: A Nationwide Sample (N=221) Table 23. Mean, Standard Deviation, and Correlations of Consumer Orientation to Slow Fashion: A Nationwide Sample (N=221) Table 24. Correlations between Slow Fashion and Existing Sustainability Table 25. Group Classifications by the Dimensions of Slow Fashion Orientation Table 26. Predictive Validity of Groups Table 27. Group Profiles by Personal Values (Schwartz Values) Table 28. Group Profiles by Apparel Consumption Behaviors Table 29. Group Profiles by Age, Education and Individual Income Level Table 30. Group Profiles by Gender and Marital Status Table 31. Confirmatory Factor Analysis of the Measurement Model Table 32. Mean, Standard Deviation, and Correlations of the Measurement Model (N=221) Table 33. Consumer Profiles for Slow Fashion Markets ix
12 LIST OF FIGURES Page Figure 1. Percent Change of Consumer Prices between 1998 and Figure 2. Total Personal Consumption Expenditures (PCE) and PCE on Clothing and Shoes...8 Figure 3. Schwartz Value Structure...41 Figure 4. Procedure of the Slow Fashion Dimension Identification...52 Figure 5. A Single-factor Model and Five-factor Model of the Slow Fashion Orientation...60 Figure 6. Proposed Conceptual Framework of Study I...65 Figure 7. Proposed Conceptual Framework of Study II...66 Figure 8. A Visual Diagram of the Measurement Model Figure 9. The Original Model (a) and the Alternative Model (b) Figure 10. Structural Equation Modeling for Testing Hypotheses x
13 CHAPTER I INTRODUCTION This chapter consists of the following sections: (1) Statement of Research Background, (2) Statement of Research Gaps, (3) Research Objectives, (4) Contributions of the Study, (5) Limitations of the Study, (6) Definitions of Key Terms, and (7) Organization of the Dissertation. Statement of Research Background This dissertation is aimed at investigating the slow fashion movement by identifying potential slow fashion consumers and ways to create customer value toward slow fashion products to increase purchase intention and willingness to pay a price premium. In this section, a brief background and concept of slow fashion will be introduced. As slow fashion emerged as an antithesis of the predominant fast fashion phenomenon, fast fashion and the movement around sustainability in the apparel industry are first introduced below. Fast Fashion For decades, fast fashion has emerged as a global trend, with fast fashion brands such as H&M from Sweden, Zara from Spain, and Forever 21 from the U.S. actively entering international markets and achieving success in the global marketplace. According to Wahba and Skariachan (2013), the sales of H&M rose 10% in the first half of 2013, with 269 stores in the U.S. For the last five years, Zara s sales in the U.S. have 1
14 tripled, and Forever 21 has increased sales by 82% in the U.S. during the same period. The success of the fast fashion business is derived from capabilities to quickly respond to fast-changing fashion trends and consumer tastes (Ghemawat & Nueno, 2003; Sull & Turconi, 2008). Indeed, the average time for H&M to produce a T-shirt in a Bangladesh factory is only 48.5 seconds (White, 2012). More importantly, the strategies that are implemented while maintaining bargain prices make the products accessible to a wide range of consumers. However, the lower pricing of fast fashion stimulates individuals to overly consume (Cline, 2012), and it compromises the quality of the product (Fletcher, 2007). The cheap fabric and poor garment construction of fast fashion cannot resist multiple launderings, and the rapid cycle of keeping up with trends has deliberately led to shortening the lifespan of fast fashion products (Byun & Sternquist, 2008). Low pricing and the deliberate obsolescence strategies result in increasing fashion waste by encouraging people to buy multiple clothes at once and to discard them shortly thereafter (Fletcher, 2010). For instance, consumers in the U.K. buy two million tons of clothing annually, which converts to 30 kilograms of clothing per person in a year (White, 2012). The consequence of the fast fashion business model, increased fashion waste, is counter to the sustainability trend. Sustainable Movements of the Apparel Industry The concept of sustainability was derived from the term sustainable development, defined as development that meets the needs of the present without compromising the ability of future generations to meet their own needs (United Nations, 2
15 1987). In general, sustainability consists of three dimensions including environmental, social, and economic (Adams, 2006). The World Summit of United Nations (2005) emphasized the integration of three aspects of sustainability to achieve sustainable development. Economic sustainability seeks to maintain growth and financial capital (Global Reporting Initiative, 2011). Social sustainability, defined by the Western Australian Council of Social Service Inc. (WACOSS), strives for human welfare by increasing quality of life through equitable, diverse, and interconnected communities (McKenzie, 2004). Environmental sustainability also seeks to ensure human welfare, but it does so through the protection of the sources of raw materials and by reducing waste (Goodland, 1995). Among the three aspects of sustainability, the apparel industry has taken significant initiatives in environmental and social sustainability with concerns about the impact of clothing on the environment and humans. As an example, the Higg Index of the Sustainable Apparel Coalition aims to evaluate the environmental and social performance of apparel and footwear products (Sustainable Apparel Coalition, 2013). Target adopts the Higg Index, and a director of social responsibility and sustainability of Target stated, This tool allows our teams (Target) to make better decisions, improve our supply chain and, most importantly, reduce our impact on the global environment (Cotton Incorporated, 2013). Moreover, after the collapse of the Rana Plaza factory in Bangladesh in 2013, 17 major U.S. retailers, including Wal-Mart, Gap, Target, and Macy s, have joined the Bangladesh Worker Safety Initiative to improve factory safety (Machlin, 2013). 3
16 Fast fashion retailers also engage in sustainable activities. By taking the idea of utilizing waste textiles (i.e., upcycling), Topshop created the Reclaim to Wear collection in which products are made of the leftovers of previous production (Gonsalves, 2012). H&M introduced a garment collecting initiative, which attempted to modify the consumer mindset to understand that old clothes can be a source of new clothing. H&M customers can exchange old clothes for a voucher for a future purchase in any of 2,800 participating stores. Through I:Co, a recycling company, the old clothes are sold to second-hand or vintage markets (Balch, 2013). H&M also claims to use sustainable cotton and plans to increasingly expand this usage to 100% by H&M has also partnered with the World Wide Fund for Nature (WWF) for water management and new industry standards development (Cotton Incorporated, 2013). Similarly, making sustainability efforts, Zara is planning to reduce CO 2 emissions by 10% by 2015 (compared to 2005 emissions) and to promote eco-friendly clothing in new product and material developments (Cotton Incorporated, 2013). Nonetheless, fast fashion retailers efforts seem to be doubtable in that they are selling a substantial number of items per year (e.g., H&M sold an estimated 550 million items in 2012), and fast fashion clothing, which is mainly made of polyester, is difficult to recycle (Balch, 2013). Slow Fashion A more recent sustainable movement in the apparel industry is slow fashion, a term first coined by British Journalist, Kate Fletcher (2007). In comparison to unsustainable fast fashion, the slow movement claims to slow down the fashion cycle with quality being emphasized, rather than quantity. The slow fashion movement occurs 4
17 in two aspects: production and consumption. Slow production does not exploit natural and human resources to expedite manufacturing speed (Fletcher, 2007), and slow consumption entails a longer product lifespan from manufacturing to discarding. Borrowing the fundamental concept from Slow Food, founded by Carlo Petrini in Italy in 1986, Fletcher (2007) suggested that slow fashion is about designing, producing, consuming, and living better by considering environmental and social sustainability, and by producing beautiful and conscientious garments. A number of fashion retailers have moved toward corresponding with the slow movement. In response to fast, cheap throwaway fashion, Levi Strauss has introduced a new and more sustainable line of clothing in the European region, namely, Made & Crafted. This line is designed to strengthen material durability and social responsibility toward factory workers in Bangladesh (Gunther, 2013). A pair of jeans, in this line, is made of a long-staple yarn grown in Pakistan, and buttonholes and pockets are reinforced for durability. Compared to conventional manufacturing methods, 30% less water and energy is consumed to produce this line. Another example of the slow movement is Raleigh Denim based in Raleigh, North Carolina. With locally produced denim fabric, the whole manufacturing process is conducted in the Curatory located in downtown Raleigh. As the philosophy is buying less, but high quality, the brand provides outstanding fit, quality, and detail of denim jeans by slower and more traditional methods of production. Generally, the price of slow fashion is much higher than that of fast fashion. In the new line of Levi Strauss, pants cost around $140, T-shirts cost $50, and jackets cost $250. A pair of Raleigh Denim jeans is sold at around $300. In contrast, fast fashion 5
18 brands like H&M sell men s T-shirts for as low as $5.95 (Wahba & Skariachan, 2013). In slow fashion, it is difficult to keep the cost low while maintaining high quality, craftsmanship, and sustainability (Clark, 2008; Pookulangara & Shephard, 2013). Given that slow fashion is oriented toward high quality and small quantities produced in a slow manner, and that slow fashion tries to guarantee a fair wage for workers (Clark, 2008), it is not surprising that the prices of slow fashion items are higher than fast fashion commodities resulting from mass production, which makes its profits by selling large amounts of cheaper products. Statement of Research Gaps A statement of the research background indicates several research gaps. First, despite the growing interest in slow fashion practice in the apparel industry, the academic understanding of slow fashion is very limited. A formal definition of slow fashion does not exist (Watson & Yan, 2013), and very few studies have researched the concept and scope of slow fashion (Clark, 2008; Fletcher, 2010; Pookulangara & Shephard, 2013; Watson & Yan, 2013). Since slow fashion is an incipient movement, the majority of the existing literature on slow fashion is exploratory and conceptual. Second, a trend of apparel research around sustainable practices has discretely focused on environmental sustainability and social sustainability. Environmental sustainability studies have primarily been directed toward organically grown and recycled materials, or toward disposal options (Shim, 1995; Hustvedt & Dickson, 2009; Niinimäki, 2010; Goworek, 2011), while social sustainability has been researched in regard to fair trade and sweatshops (Dickson, 1999; Dickson, 2000; Halepete, Littrell, & Park, 2009). 6
19 Slow fashion may have a broader perspective encompassing both environmental and social sustainability; however, academic studies have not been able to provide theoretical evidence confirming a conceptual association between slow fashion and existing environmentally and socially sustainable fashion. Third, an understanding of the slow fashion consumer is significantly lacking. While slow fashion entails the whole supply chain including both production and consumption (Johansson, 2010; Pookulangara & Shephard, 2013), current state-of-the-art slow fashion studies do not provide complete information about the aspect of slow fashion consumers. Without understanding the characteristics of slow fashion consumers, it is difficult to establish further marketing strategies. Fourth, it is not certain how many consumers would adopt the slow fashion concept in their apparel buying decisions due to slow fashion s higher pricing. In particular, U.S. consumers seem to be habituated to the low price of apparel products. As presented in Figure 1, apparel and footwear consumer prices have been lowered, although overall consumer prices for all products have increased 32% from 1998 to Also, there has been nearly no change in apparel expenditures for 50 years, while total personal consumption expenditures (PCE) have been dramatically increasing in the same period (Figure 2). Considering this situation, it is uncertain whether the higher price range of slow fashion products appeals to U.S. consumers. Therefore, it is imperative for slow fashion firms to understand how to help consumers perceive the value of their products so that consumers are more willing to buy and pay a higher price. 7
20 Figure 1. Percent Change of Consumer Prices between 1998 and 2008 Percent change All item Apparel & Footwear Source. American Apparel & Footwear Association (2009). p. 7. Figure 2. Total Personal Consumption Expenditures (PCE) and PCE on Clothing and Shoes Billions of dollars Total Clothing & Shoes Source. U.S. Bureau of Economic Analysis (2012). 8
21 Research Objectives In order to bridge the research gaps, this study proposes the following research questions: (1) What is slow fashion?, (2) Who will potential slow fashion consumers be?, and (3) How do slow fashion brands encourage consumers to pay more to buy slow fashion products? First, this study is aimed at elucidating the concept of slow fashion and providing its theoretical definition by exploring its underlying dimensions with an empirical data set. Following Churchill s (1979) paradigm for developing measurement, the scale item generation, purification, and verification stages will be conducted by measuring consumer orientation in relation to slow fashion. Scale items have been generated and purified through several surveys in the preliminary study, and the developed scale will be validated in this study s main survey. The sub-dimensions identified in the scale development will manifest a conceptual similarity and difference with existing sustainability concepts of the apparel industry. Based on a clear concept of slow fashion, the two parts of the study are designed to examine the following research questions. Study I is designed to profile the characteristics of potential slow fashion consumers, and Study II tests a research framework that shows how consumers perceived values of slow fashion facilitated consumers to buy slow fashion products. Specifically, in Study I, the potential slow fashion consumer segments will be segmented based on consumers orientations in relation to slow fashion, and then profiled by Schwartz personal values, apparel consumption behaviors, and demographics. For Study II, built on the customer value 9
22 creation framework, hypothetical relationships among the dimensions of consumer orientation to slow fashion, perceived customer value, consumers willingness to purchase, and willingness to pay a price premium toward slow fashion products are tested. Contributions of the Study This study anticipated academic and practical implications. First, establishing a theoretical definition of slow fashion extended the body of knowledge about slow fashion. By providing a key understanding of the movement, slow fashion dimensions will facilitate future studies and clearly show how the concepts of slow fashion are related to environmental sustainability and social sustainability in theoretical perspectives. Second, this study is one of the first attempts to profile potential slow fashion consumers, and offers very fundamental information for marketing strategies. Personal values form attitudes that lead to behavior and decision making (Huber, Herrmann, & Morgan, 2001), and an individual is attracted to different product attributes depending on personal values (Doran, 2009). Thus, profiling consumers by personal values is critical to acknowledge target consumers. In this study, the Schwartz value types are employed to examine personal values; this tool is the most widely accepted in values research (Lindeman & Verkasalo, 2005; Ma & Lee, 2012; Wu, Cai, & Liu, 2011). In addition to personal value, apparel consumption behaviors and demographic information were also profiled in potential slow fashion consumer segments. This profiling gives a comprehensive understanding about slow fashion consumers. Third, based on the customer value creation framework, hypothetical relationships among slow fashion dimensions, perceived customer value, and purchase and pay a price 10
23 premium intention are tested. Though consumers acknowledge that the slow fashion model improves sustainability and that it is important to strive for sustainable options, if they hesitate to buy the product due to its higher price, the slow fashion concept may not be sustainable in the industry. The findings of the hypothetical relationships will suggest factors associated with consumers purchase intention and willingness to pay price premium toward slow fashion products. Consumers intention to pay a price premium might vary by attributes of the firm s offering (De Pelsmacker, Driesen, & Rayp, 2005). Therefore, investigating how each dimension of slow fashion creates customer value will suggest attributes that influence consumers intention to pay more money for the slow fashion purchase. Fourth, the customer value creation approach will provide a viable strategy for the U.S. domestic apparel firms. Slow fashion products are manufactured at low speed, focusing on high quality. Similar to the slow food movement, which is rooted in local production, slow fashion may suggest ways to foster domestic apparel firms by encouraging local production. The structural model of customer value creation will suggest a guideline to establish strategy of the domestic apparel firms. Limitations of the Study First, this study developed measures of consumer orientation to slow fashion, because no such scales existed in the literature. Development of these measures helps to clearly state the concepts and dimensions of slow fashion. However, this measurement should be further validated through more surveys with various samples. While this study 11
24 conducted scale validation through a main survey, it is necessary to refine the scale to strengthen reliability and validity through future studies. Second, since this study only targeted a nationwide U.S. sample, the findings may not be applicable to other countries. Given that a number of slow initiatives have emerged in different countries, further study should be investigated cross-culturally to generalize the findings. Definitions of Key Terms Customer Value: A consumer s comparative perception and evaluation of benefits derived from a firm s offering for costs paid (Holbrook, 1999; Woodruff, 1997; Zeithaml, 1988). Customer Value Creation: Creation of superior value compared to competitors by substantiating key benefits and costs of a firm s offering (Anderson, Narus, & Van Rossum, 2006; Smith & Colgate, 2007). Fast Fashion: A fashion practice that carries high-end designs to the mass market at affordable price ranges quickly, which is implemented by retailers such as Topshop, Zara, H&M, and Forever 21 (Ghemawat & Nueno, 2003; Sull & Turconi, 2008). Personal Values: Concepts or beliefs about desirable end states or behaviors that transcend specific situations, guide selection or evaluation of behavior and events, and are ordered by relative importance (Schwartz, 1994). Price Premium: The excess price paid over the true value of the product (Rao & Bergen, 1992). 12
25 Schwartz Values: Ten types of value (i.e., universalism, benevolence, tradition, conformity, security, power, achievement, hedonism, stimulation and selfdirection), measured by 56 items. Each value type has a distinctive motivational goal, and the 10 value types form a continuum with the shared motivational goals of adjacent value types (Schwartz & Bilsky, 1987; Schwartz, 1994). Slow Fashion: The new fashion paradigm that is about designing, producing, consuming, and living better. Slow fashion is not time-based but quality-based, requiring a different approach in which designers, buyers, retailers, and consumers are more aware of the impacts of products on workers, communities, and ecosystems (Fletcher, 2007). Sustainable Development: Development that meets the needs of the present without compromising the ability of future generations to meet their own needs (United Nations, 1987). Sustainability: The concept derived from sustainable development, which consists of three aspects: economic sustainability, environmental sustainability, and social sustainability (Adams, 2006; United Nations, 2005). - Economic Sustainability concerns economic growth and financial feasibility (Ramjohn, 2008; Global Reporting Initiative, 2011) - Environmental Sustainability is related to protecting the sources of raw materials used for human needs and reducing wastes to ensure human welfare (Goodland, 1995). 13
26 - Social Sustainability focuses on supporting the capacity of current and future generations to create healthy and livable communities (WACOSS, as cited in McKenzie, 2004) Organization of the Dissertation This dissertation will consist of five chapters. Chapter I addresses a brief background of the study, the research gaps found in the background, the research objectives to bridge the gaps, potential contributions of the study, limitations, and definitions of key terms used throughout the study. Chapter II provides a thorough review of the literature regarding sustainability, slow fashion, and theoretical foundations including the Schwartz value and the customer value creation framework. Based on the literature review, this study proposes two parts of conceptual frameworks: profiling consumer segments (Study I), and structural equation modeling to test hypotheses (Study II). This chapter also presents a preliminary study in which a scale that identifies the slow fashion dimensions is developed. Chapter III explains the methodology that will be used to conduct this study: data collection, survey instrument development, and statistical methods for analyses. Chapter IV will report the results of the study, and Chapter V will discuss the results and provide implications, limitations and suggestions for future studies. 14
27 CHAPTER II LITERATURE REVIEW This chapter provides a literature review of the major concepts and theoretical foundations of this dissertation, an overview of the proposed conceptual frameworks, a preliminary study, and the details of the conceptual frameworks. The major concepts, sustainability and slow fashion, are reviewed. In addition, the two theoretical foundations of this study, the Schwartz value structure and the customer value creation framework, are examined. An extensive literature review proposes conceptual frameworks to two parts of the study: profiling slow fashion consumers and hypotheses testing based on the customer value creation framework. Also, the findings of a preliminary study that attempted to identify the dimensions of slow fashion are presented. This chapter outlines these topics in the following order: (1) Sustainability, (2) Slow Fashion, (3) Theoretical Foundations, (4) Proposed Conceptual Frameworks, (5) Preliminary Study: Identifying Dimensions of Consumer Orientation to Slow Fashion, (6) Study I: Profiling Potential Slow Fashion Consumers, (7) Study II: Structural Equation Modeling to Test Hypothetical Relationships and (8) Summary. Sustainability Concept of Sustainability Since sustainable development was addressed in 1987 at the World Commission on Environment and Development, otherwise known as the Brundtland Commission, 15
28 sustainability has been discussed in terms of its definition and practice. The Brundtland Commission s definition of sustainable development is the most widely accepted: development that meets the needs of the present without compromising the ability of future generations to meet their own needs. It is noteworthy that the commission emphasized sustainable development, rather than sustainability. The attempt to make development sustainable highlights the focus on development rather than questioning development and growth. The politically experienced commissioners realized that no-growth or limits to growth approaches would be unacceptable to wealthier nations as well as to developing nations (McManus, 1996). In this sense, the Brundtland Commission advocated for improving the efficiency of growth, instead of economic stagnation, by reducing the use of material resources and increasing growth in a more equitable manner. The concept of a sustainable development approach was further emphasized by the United Nations Conference on Environment and Development (UNCED) in Rio de Janeiro, in 1992 (McManus, 1996; United Nations, 1992). With a redefinition of developmental goals by considering wider social and environmental aspects, rather than a narrow economic focus, UNCED refereed to overconsumption in developed countries as a direct cause of unsustainability through Agenda 21. By promoting eco-efficiency, the importance of shifting consumption patterns was stressed as efficiency along was not enough to compensate for consumption volumes (Fuchs & Lorek, 2005). For example, using public transportation achieves sustainability by changing a consumption pattern, whereas buying an energy efficient car focuses solely on an efficiency approach (Seyfang, 16
29 2006). Agenda 21 also suggested that the concepts of wealth and prosperity should be newly defined at the government level toward higher standards of living through changed lifestyles that maintain harmony with the Earth s carrying capacity (United Nations, 1992). Mainstream thoughts about sustainability tend to be based on three dimensions: environmental, social, and economic sustainability (Adams, 2006). In the World Summit of United Nations (2005), the integration of economic, social, and environmental aspects was emphasized as a way to achieve sustainable development. Economic sustainability is defined as maintenance of capital (Goodland, 1995, p. 3) and captures growth, financial feasibility, and an organization s impacts on the economic conditions of its stakeholders, as well as the local, national, and global levels of the economic system (Ramjohn, 2008; Global Reporting Initiative, 2011). The second aspect, social sustainability, is geared toward the wellbeing of humans and created by supporting the capacity of current and future generations to create healthy and livable communities (WACOSS, as cited in McKenzie, 2004, p. 18). Through cohesion of community, cultural identity, diversity, tolerance, humility, and equity (Goodland, 1995), socially sustainable communities are inclusively considerate, diverse, and interconnected, all of which provide a good quality of life (WACOSS, as cited in McKenzie, 2004). The third aspect of sustainability, environmental sustainability, protects the sources of raw materials used for human needs and reduces wastes to ensure human welfare (Goodland, 1995). In previous studies, three ways to improve human welfare by maintaining natural resources have been identified: (1) waste emissions should not exceed the assimilative capacity of 17
30 the environment, (2) the rate of extraction of renewable resources (i.e., harvest) should be kept within the regeneration rate, and (3) the extraction of non-renewable resources should be minimized, and depletion rates should be equal to the rate at which renewable substitutes can be created (Goodland, 1995; Ramjohn, 2008).With these three dimensions of sustainability as a guide (i.e., economic, social, and environmental sustainability), this study gives a detailed review on how sustainability is implemented in the apparel industry. Sustainability in the Apparel Industry The above discussion clearly shows that the concept of sustainability in mainstream thought encompasses three dimensions: economic, social, and environmental sustainability. Reflecting these three dimensions, recently, some initiative organizations in the apparel industry, such as the National Association of Sustainable Fashion Designers and The Sustainable Fashion Initiative, have attempted to integrate economic, social, and environmental sustainability as sustainable fashion. Nonetheless, the industry has largely focused on environmental and social sustainability, which include ecofriendly materials, reducing consumption volume, promoting recycling, enhancing working conditions of producers, and trading fairly with developing countries (Hiller Connell, 2011; Goworek, 2011). Concerning materials, consumption volume and recycling are clearly associated with environmental sustainability, whereas better working conditions and fair trade are ways of achieving social responsibility. Separating the environmental and social aspects, the next section will discuss the different types of sustainability in the industry. 18
31 Environmental Sustainability Consumer products are environmentally consequential (Hiller Connell, 2011). In particular, all lifecycle stages of clothing affect the environment. Energy, chemicals, and water are consumed to produce raw materials and manufacture clothing. As an example, a cotton T-shirt consumes 109 mega-joules of energy from fiber production to disposal (Hiller Connell & Kozar, 2012). Because cotton requires a substantial amount of pesticides and insecticides while it is growing due to its vulnerability to insect attacks, it is estimated that cotton requires 10% of the annual worldwide usage of all synthetic pesticides (Gam, Cao, Farr, & Kang, 2010). The impact is toxic and persistent in the environment, leading to the poisoning of farmers, as well as degradation of natural resources. In the dye process, consumption is estimated to be liters of water per pound of textile (Hiller Connell & Kozar, 2012). Transports between supply chains, and transports from supply chains to end consumers consume energy and generate pollution. Laundry is also environmentally harmful because of the variety of chemicals that are used in dry cleaning processes and home laundry (Hiller Connell, 2011). Finally, clothing may move to landfills at the end, unless reused or recycled, increasing the Earth s solid waste loads. Due to the fragmented supply chain of apparel products, incorporating environmental sustainability into the manufacturing process is complicated. For this reason, with a limited view, the apparel industry has mainly attempted to replace harmful chemicals with environmentally friendly materials to decrease environmental impacts, such as organically grown and recycled material (Niinimäki, 2010; Goworek, 2011; 19
32 LeBlanc, 2012). For instance, Nike Inc. developed the Materials Sustainability Index (MSI) to select better materials in terms of reducing energy, chemicals, water, and waste. Later, the MSI was incorporated into the Higg Index of the Sustainable Apparel Coalition, which aims at evaluating the environmental and social performance of apparel and footwear products (Sustainable Apparel Coalition, 2013). However, the focus on materials is just a part of sustainable environmental practices that reduce waste emissions. Substantial consumption may also cause the release of toxins into water and soil, and degradation of the land just as high levels of consumption entail the depletion of natural resources, including not only fiber, but also water and energy to process the fiber. Patagonia released the Don t buy this jacket campaign with the claims while the jacket is made from recycled polyester, it still generates 24 times its weight in carbon emission and uses enough water to meet the daily needs of 45 people (Sweeney, 2012). Through this advertisement, the brand aimed to encourage people to buy less. Recycling is also a critical way of cutting resource consumption and reducing the footprint to the environment. Moreover, since many clothing articles are made of synthetic fibers derived from petroleum, and even natural fibers are treated with chemical processes that make the material non-renewable, the environmental approach should be geared toward reducing the amount of non-renewable resources and sustaining the depletion rate. With regard to studies on environmentally sustainable apparel consumption, what drives consumers to eco-friendly material purchase and clothing disposal behavior were mainly investigated. For example, Butler and Francis (1997) found that environmental 20
33 clothing purchasing behavior is influenced by not only clothing-specific environmental attitudes, but also by general environmental attitudes. Similarly, Kim and Damhorst (1998) reported that environmental knowledge and environmental concern affect general environmental behavior, which in turn drives environmental apparel consumption. More recently, Gam (2011) suggested that purchase intention for eco-friendly clothing is directed by fashion orientation, as well as environmental concern. This finding implies the importance of attractive merchandise selection in eco-friendly apparel markets. In fact, although green marketing strategies aim at encouraging consumers to buy eco-friendly clothing, consumers are less likely to engage in such purchases because the limited assortment precludes self-expression and aesthetic satisfaction (Butler & Francis, 1997; Niinimäki, 2010; Niinimäki & Hassi, 2011; Hiller Connell & Kozar, 2012). In a clothing disposal behavior study, Shim (1995) examined consumers clothing disposal patterns, such as resale, donation, reuse, and discard, in relation to consumers general environmental attitudes and waste recycling behaviors. Environmental attitude was found to be a stronger indicator of environmentally friendly disposal options than was waste recycling behavior. Domina and Koch (1998) also classified consumer segments with different motivations of recycling, and found that the group that was knowledgeable about recycling and actively engaged in recycling was more concerned about the environment, compared to the other groups. In sum, environmentally sustainable apparel consumption, which seeks for clothing to be made from eco-friendly materials or to be recycled as used clothing, is largely influenced by a consumer s positive attitude toward the environment, environmental knowledge, and concerns about the environment. 21
34 Social Sustainability The concept of social sustainability is strongly related to corporate social responsibility (Hutchins & Sutherland, 2008). With the growing interest in social responsibility, the apparel industry has become more concerned with the social impacts of clothing. In the 1980s and 1990s, due to anti-fur campaigns, many apparel brands did not use fur because of concerns for animal welfare (LeBlanc, 2012). Also, given that the apparel industry is labor-intensive, workers welfare has been threatened through excessive workload, low wages, poor working conditions, labor exploitation related to children and maternity, and emotional or physical harassment from supervisors (Hiller Connell & Kozar, 2012; Rudell, 2006). These conditions are prevalent in sweatshop operations. Employers in sweatshops operations often violate[s] more than one federal or state labor law governing minimum wage and overtime, child labor, industrial homework, occupational safety and health, workers compensation, or industry registrations (U.S. General Accounting Office, as cited in Dickson, 2000, p. 19). In sweatshops, workers continue to perform the same tasks for hours each day, six to seven days a week (Rivoli, 2009), and the average hourly wage in developing countries is less than $2 (Ross, 2004). According to the U.S. Bureau of Labor Statistics (2012), the average hourly compensation is $1.70 in Mexico, $0.86 in China, and $0.23 in Pakistan, which is far less than the $12.17 in the U.S. In developing countries, however, actual wages may be lower due to fines on workers or forced overtime (Rudell, 2006). Fierce price competition in the world aggravates poor working conditions and lower wages; it 22
35 also exploits child labor with payments as little as $1 for 10 hours of work a day (Claudio, 2007). With U.S. consumers increasing their interest in human welfare in the 1990s, firms that were perceived as neglecting the social impact of their business were criticized (Kim, Littrell, & Paff Ogle, 1999). The public advocated for the improvement of labor practices, which resulted in the boycott of products sold by companies, such as Nike and Gap (Shaw, Hogg, Wilson, Shui, & Hassan, 2006). Corresponding to the growing power of the media, labor, and consumer action groups, a number of initiatives have emerged in government as well as at the industry level (Kim et al., 1999). For example, in 1996, a White House Task Force was inaugurated to enact a code of conduct on worker s wages and the working environment; as a result, the Fair Labor Association has been supported by the apparel industry, nonprofit organizations, and universities, supporting factory inspections and certification programs (Rudell, 2006). Furthermore, many campaigners and consumers believe that fair trade practices would further improve workers welfare (Shaw et al., 2006). Fair trade organizations are involved in ensuring fair compensation and safety in working conditions, considering environmental sustainability, and developing communities (Halepete, Littrell, & Park, 2009; Littrell, Ma, & Halepete, 2005). In fair trade commerce, it is possible to fulfill consumers needs in socially sustainable ways by connecting artisans and consumers. The mission of fair trade is to reduce poverty and strengthen fair relationships with artisan producers who are economically marginalized (Ma & Lee, 2012). In fair trade, artisans emphasize quality of life and a fair wage for workers, and consumers understand the 23
36 philosophy of fair trade, which increases artisans profitability by distinguishing them from mainstream business approaches (Littrell et al., 2005). One retail shop chain, Ten Thousand Villages, is a good example of fair trade. It sells handcrafted items from Asia, Africa, Latin America, and Middle Eastern countries to secure the profitability of artisans in those countries by building up long-term buying relationships. In turn, through partnership with skilled artisans in less developed countries, the retailers sell unique handmade items to U.S. consumers, and the artisans have an opportunity for a stable income. Also, alternative trading organizations exercise fair trade with producers in developing countries. By eliminating the middleman, these organizations promote working directly with producers on design, quality control, management, and shipping (Kim et al., 1999). Dickson and Littrell (1996) found that consumers who purchase handcrafted apparel items from alternative trade organizations are more likely to be oriented to societal values, have a greater concern for workers, and consequently support the fair trade movement. Dickson (2000) also found that concern for workers positively supports socially responsible businesses. Likewise, the apparel industry is closely tied to sustainability by taking the environmental and social impacts of clothing into account. As stated, a more recent sustainable movement in the apparel industry is slow fashion. The following section will specifically delineate a background and concept of slow fashion. Slow Fashion In the apparel industry, the slow movement began with the term slow fashion coined by Kate Fletcher (2007). As a way of being sustainable but fashionable, slow 24
37 fashion claims to slow down the fashion cycle via a combination of slow production and consumption. As a counteraction to the prevailing fast movement, such slow approaches have emerged in various areas, such as the slow food and slow life movements (Mayer & Knox, 2006; Nilsson, Svärd, Widarsson, & Wirell, 2011; Tencati & Zsolnai, 2012). To find common themes of the slow culture and to better understand the concept of slow fashion, this section begins with a discussion of the slow food movement. Slow Food was founded in 1986 by an Italian gourmand, Carlo Petrini, who was opposed to the opening of a McDonald s restaurant next to the Piazza di Spagna in Rome. The movement has gradually expanded to dissent the proliferation of corporate centered dynamics such as fast food restaurants in countries that have traditionally been attached to the origins of food (Mayer & Knox, 2006). The slow food movement is a way of living and eating, which pursues pleasure of food with commitment to the community and the environment (Slow Food USA, 2013). Against the current mainstream of global production, slow food emphasizes locally grounded production, which maintains the viability of local restaurants and farms (Mayer & Knox, 2006). The slow food movement also helps consumers to better understand their food with local tradition and culture by shortening the distance between producers and consumers. Moreover, since local production reduces food transporting, the slow food movement is environmentally healthy by preventing various types of pollution and the waste of energy. More importantly, slow food produces foods in a way that follows the natural rhythms and seasons by suspending the production and consumption loop, instead of squeezing the land s capability to grow food through the use of chemical fertilizer. Therefore, the 25
38 traditional way of farming helps preserve almost-extinct local species and achieve biological diversity. In addition, the diversity through locally distinctive taste allows people to truly enjoy the pleasure of eating. Similarly, slow fashion emerged as an antithesis of the current fast fashion system, which results in environmental and social unsustainability. Slow fashion s underlying philosophy is consistent with the slow food movement. Not simply about slowing down the pace of the fashion cycle, slow fashion is a socially conscious movement that shifts consumers mindsets from quantity to quality, encouraging people to buy high quality items less often (Fletcher, 2007). In order to clarify the slow fashion concept, this study first reviews fast fashion, which sets the background for the slow fashion movement, and then examines the concept of slow fashion from production and consumption perspectives. Background: Antithesis of Fast Fashion For decades, the ubiquitous practices of the apparel industry have involved rapid production, short lead time, and an increased number of fashion seasons with lower cost materials and labor (Bhardwaj & Fairhurst, 2010; Fletcher, 2010). This is the core of the fast fashion business model implemented by companies such as Zara, H&M, and Forever 21. Due to the variation of fashion trends and consumer tastes, it is impossible for apparel companies to forecast demand accurately. Thus, managing uncertain demands becomes critical in the apparel industry (Jin, Chang, Matthews, & Gupta, 2011). In order to catch the volatile consumer demands, the number of fashion seasons has been increased and lead time has been shortened; these characteristics are reflected well in the fast fashion 26
39 business system. In contrast to the traditional apparel business model, which involves up to six months for design and three months for manufacturing, fast fashion brands typically take several weeks from originating a design to having finished goods in stores (Ghemawat & Nueno, 2003; Sull & Turconi, 2008). Also, the fast fashion model employs deliberate undersupply and no replenishment strategies for efficient inventory management (Sorescu, Frambach, Singh, Rangaswamy, & Bridges, 2011). The small amount of stock leads to the cutting of markdown rates and the creation of a sense of scarcity, which induces consumers to evaluate these products more favorably with more perceived value (Eisend, 2008). The message of buy now because you won t see this item later urges consumers not to delay their purchase and to visit the stores more frequently (Byun & Sternquist, 2008). Indeed, the fast fashion model seems to provide more choice to consumers, yet the limited amount of stock pushes them to expedite their decision making. Another competitive strategy of fast fashion is affordable pricing. To secure lower prices, fast fashion retailers are involved in strategic operations. For instance, Zara outsources basic price-sensitive items in Asia where the production cost is 15-20% cheaper than in Europe, while time-sensitive trend items are produced internally or by proximately located suppliers (Ghemawat & Nueno, 2006). Fast fashion retailers success is largely epitomized as their ability to quickly carry high-end designs to the mass market at affordable price ranges. However, the lower price is a result of compromising the product quality, and illustrates the idea of clothes to be worn 10 times (Ghemawat & Nueno, 2003, p. 13), which contributes to stimulating overconsumption (Cline, 2012). The cheap fabric and poor garment construction of fast 27
40 fashion cannot resist multiple launderings. Moreover, the rapid trend of keeping up with fashion has led to perishable fashion clothes by shortening the lifespan of the product deliberately (Byun & Sternquist, 2008). Along with the low pricing strategy, deliberate obsolescence of durability and style spurs people to buy multiple clothes at once with little perceived value and discard them shortly (Fletcher, 2010). Indeed, the fast business model generates profits by spurring overconsumption. Given that the U.S. consumption of apparel is approximately twenty billion garments per year (American Apparel & Footwear Association, 2009) and that consumers are discarding higher volumes of clothing than ever before (Morgan & Birtwistle, 2009), the main criticism of the fast fashion business model lies in its profit model, which is achieved at the expense of sacrificing sustainability. Concept of Slow Fashion Pointing out that consumers do not need to buy new trends every few weeks as the fast fashion retailers are providing, slow fashion emphasizes that consumers should make more conscious shopping decisions that reassess the impact of clothing on producers, consumers, and the environment (Slow fashioned, 2012). Slow fashion was first coined by Fletcher: Slow fashion is about designing, producing, consuming and living better. Slow fashion is not time-based but quality-based. Slow is not the opposite of fast there is no dualism but a different approach in which designers, buyers, retailers and consumers are more aware of the impacts of products on workers, communities and ecosystems. (2007, p. 61). 28
41 Since, the concept and practice of slow fashion has been discussed as a way of resolving unsustainability issues in the current apparel industry. Clark (2008) explained slow fashion as more sustainable and ethical ways of being fashionable that have implications for design, production, consumption, and use (p. 428), and provided three characteristics of the movement: the valuing of local resources, transparent production systems, and sustainable and sensorial products. Being oriented to the local by capitalizing on local culture or local resources, slow fashion is likely to have less intermediation between producer and consumer, compared to global production where multiple countries engage in producing a piece of clothing. Local production is more transparent in the supply chain, and transparent production systems may facilitate collaborations between designers, producers, and consumers; thus, local orientation and a transparent system ensure community development and diversity, which are the main component of social sustainability. Slow fashion also strives to achieve a high quality product with longer usability to enhance environmental sustainability. Cataldi, Dickson, and Grover (2010) referred to slow fashion as a new model that integrates eco, ethical, and sustainable fashion into a movement. On the basis of slow food, Cataldi et al. (2010) demonstrated the characteristics of slow fashion, including increased quality of the life of workers, reduced raw materials consumption, reliance on local resources, and traditional methods. Extending a previous focus on environmentally friendly materials, slow fashion broadens the sustainable perspective to the pace of production. Cataldi et al. (2010) indicated that slowing down the production cycle of clothing enables the environment 29
42 and people in that environment to co-exist in a healthier way, and allows time for the environment to regenerate. Without exploiting natural resources, low speed production enables raw materials to grow naturally (Fletcher, 2007). Inherently, slow fashion is ecofriendly since items are produced slowly in small batches, which reduces the consumption of resources and the amount of waste (Cline, 2012). Slower production also improves the quality of life of all workers, guaranteeing their fundamental human rights by taking off the time pressure in the production of clothing. In longer term planning, producers may have more time to build mutual relationships among workers. Instead of temporary or subcontracted workers taking on an excessive workload to meet unpredictable demands, slow fashion workers are able to be employed with regular working hours secured. Meanwhile, slow fashion workers can spend more time on each garment, which enhances the quality of the products. Aiming at meeting human needs, Cataldi et al. (2010) suggested co-creating garments with consumers as a pivotal characteristic of slow fashion, in contrast to the mass production system. In the slow fashion system, it is possible for designers to invite consumers into the design process, which satisfies the consumers needs of creativity and identity. While the co-creation process fosters connections between producers and consumers, it encourages consumers to act more responsibly with an increased awareness of how a garment is made. Denim jeans brand, Raleigh Denim, produces jeans entirely in North Carolina. The brand s practice is very similar to the slow fashion approach, and it engages in slower and more traditional ways of production with the philosophy of buying less, but high quality. Owned by a husband and wife designer team with a small number of 30
43 artisans, the brand provides outstanding fit, quality, and detail of denim jeans by utilizing traditional construction. According to an NC SBTDC report (2012), the brand is very successful seeing that the revenue of the brand has more than doubled each year since launching in A pair of Raleigh Denim jeans is sold for $300 at high-end specialty boutiques such as Barneys New York, and the brand recently opened its own store in New York. Using the example of Raleigh Denim, this study describes slow production in detail. In particular, Table 1 presents the contrasting tendencies of slow fashion and fast fashion, which represent the general idea of slow culture and fast culture. Following Table 1, the slow production of Raleigh Denim is further explained. Table 1. General Tendencies of Slow and Fast Fashion Slow Fashion Fast Fashion Sustainable Unsustainable Equitable Inequitable High quality Low quality Authentic Copied Customized Standardized Craft Industrial Asset-specific Homogenized Idiosyncratic Replicable Grassroots Corporate Sensitive to local history Insensitive to local history Source. Modified from Mayer and Knox (2006). p Sustainable and equitable: The brand philosophy encourages consumers to buy one pair of high quality jeans and to wear this pair more often instead of buying two pairs of lower quality jeans (Hatem, 2011). This implies that a high quality offering enhances longevity and contributes to cutting down the consumption 31
44 level. Accordingly, slow fashion products achieve environmental sustainability. Moreover, slow production is socially and environmentally equitable, in that it does not force excessive work for people to shorten lead time, and does not abuse the lands capacity to produce raw materials quickly (Fletcher, 2007). High quality and authenticity: As mentioned above, Raleigh Denim provides quality elaborated products. Because low speed production generates far less stress on the yarn without expediting growth speed through fertilizer, the denim fabric has a softer touch and is more durable. With a high quality fabric, the entire construction process is done by artisans manual labor. Capitalizing on original shuttle looms and traditional construction methods, the brand strives to achieve craftsmanship that has longer lasting value and improves product quality, allowing a richer interaction between producers and clothes. Moreover, each pair of Raleigh Denim jeans has a unique number that is hand stamped on the garment. Therefore, the brand product is authentic rather than mass produced by machines. Idiosyncratic and asset-specific: Rather than hinging on large amounts of copies made by machines, Raleigh Denim has produced idiosyncratic pieces of clothing based on unique assets, such as contemporary fit and a special chain-stitch hemmer. Since products are made by artisan s manual labor, they are not as precisely consistent as those made by machines. That is, each product has distinctive features as well as has its own history. In addition, as the brand 32
45 stresses that each pair is one of a small batch, the product is provided in a limited quantity. Grassroots and sensitivity to local history and culture: As stated before, Raleigh Denim is a small team established by a husband and wife, and the company employs local artisans. The brand deals with the whole process of production, ranging from initial design to finishing, under one roof. Also, the brand is 98% local by using local materials and facilities (Biemann, 2009). Since North Carolina was one of the mainstays for denim production in the past, local mills and artisans still remain. White Oak, which is a 100-year-old local mill, weaves the fabric on the original shuttle looms and provides Raleigh Denim with denim fabric. Moreover, slow fashion requires a more holistic view by taking into account not only how to produce but also how to consume. This is true because ever sustainable production can become unsustainable when garments made of eco-friendly materials are worn only a few times and discarded quickly (LeBlanc, 2012). A simple way of improving the positive impact of clothing on the environment and society is to have unused clothing mended, recycle, resell, or donate when the products are no longer used. Some apparel brands have designated creative ways to facilitate recycling, such as Timberland, which designs shoes with several simple components so that they can be disassembled later (LeBlanc, 2012). However, a more critical matter is to prolong the product s lifecycle and maximize its utility. A longer product lifespan allows reducing consumption of natural resources and the waste of energy. Slow fashion encourages 33
46 people to buy less at a higher and more durable quality. In slow and sustainable fashion systems, however, quality is not only about the physical, but it also includes design aspects. In other words, highly qualified design products are long lasting in terms of style (Johansson, 2010). With designs that are less influenced by fleeting fashion trends and with clothing made of durable materials, people can wear the clothing for a long time, regardless of fashion seasons. This increased longevity implies slow consumption. In slow consumption, consumers may take time to fully appreciate fashion and hold the clothing for a long time, thereby fulfilling needs for personal identity rather than following fast-moving identical trends (Johansson, 2010). Furthermore, sustainable designs often consider multiple outfits, which increase versatility (LeBlanc, 2012). Buying a piece of high quality clothing and wearing it more often in multiple ways meets a sustainable way of being fashionable, which is a principal of slow fashion (Clark, 2008). For instance, a number of media sources, such as the New York Times, CNN, BBC, Elle, and Marie Claire, have paid attention to the Uniform Project. The project launched in 2009 when Sheena Matheiken decided to wear one black dress for an entire year in unique ways with handmade, recycled, or donated accessories. The project was born against the corporate world where there is a lack of creativity, ethics, and sustainability. As a sustainable exercise, Matheiken has continued to expand her idea into an ongoing mission. To compare slow fashion consumers with fast fashion consumers, Watson and Yan (2013) defined slow fashion consumers as those who choose to purchase high quality, versatile clothing that allows them to build a wardrobe based on the concept of 34
47 clothing created out of care and consideration (p. 155). As Table 2 clearly shows key differences between the two consumer types, higher utility during usage is required in slow fashion, such as multiple outfits with a piece of clothing, nice fit, and high quality. Expecting a longer lifespan from the clothing, slow fashion consumers seek classic and timeless styles that do not fade out after a couple of fashion seasons. Also, slow fashion consumers expect a higher price range of clothing. Since the clothing is high quality and produced in small quantities, a higher price range for slow fashion products is inevitable. This is compared to mass production, which makes its profits by selling large amounts of cheaper products. Fast fashion consumers desire to purchase multiple clothing pieces with the same amount of money. They want to catch fashion trends quickly and to possess a variety of fashion clothing. When a trend becomes outdated, they are likely to discard and replace their wardrobe with new trendy items. Table 2. Differences between Slow Fashion Consumers and Fast Fashion Consumers Slow Fashion Consumer Fast Fashion Consumer Utility Versatility, Fit, Quality Affordability, Quantity Style Classic, Timeless Unique, Trendy, Variety Consumer s expectation Fit, Quality, Long lifespan, Versatility, Low maintenance, Higher price Low quality, Short lifespan, Replaceable, Affordability Source. Modified from Watson & Yan (2013). p Thus far, this chapter has reviewed the background and concept of slow fashion with industry practices and relevant studies. However, despite the growing interest in slow fashion in the fashion industry, the academic understanding of slow fashion is very limited. This lack of understanding may be partly because of a lack of formal definitions 35
48 (Watson & Yan, 2013) and studies that have investigated the concept and scope of slow fashion (Pookulangara & Shephard, 2013; Watson & Yan, 2013). Therefore, researching the movement is needed to extend the body of knowledge about slow fashion and to provide implications for the sustainability of fashion. Theoretical Foundations To understand slow fashion consumers and the creation of values through slow fashion, two major theoretical foundations were utilized in the design of this study: the Schwartz values and the customer value creation framework. This section extensively reviews the concepts and previous studies of each foundation. Schwartz Values Concept of Value Values are defined as desirable trans-situational goals, varying in importance, that serve as guiding principles in the life of a person or other social entity (Schwartz, 1994, p. 21). In consumer behavior, values play the role of fundamental beliefs that direct or motivate our behaviors and decision making (Solomon & Rabolt, 2004). As seminal work to classify the vast number of values, Rokeach (1973) proposed two sets of values: 18 terminal values and 18 instrumental values. A terminal value refers to desired end states, and an instrumental value is a tool to achieve terminal values (Solomon, 2011). From a theoretical base of Rokeach (1973), the List of Values (LOV) scale (Kahle, 1983) identified nine values: self-respect, security, warm relationships with others, sense of accomplishment, self-fulfillment, sense of belonging, being well respected, fun and enjoyment in life, and excitement. This scale can be used to classify people on Maslow s 36
49 (1954) hierarchy, and these values are more closely tied with life s major roles than are the values in the Rokeach value survey. Also, a person shows different consumption behaviors by each value on the LOV scale (Solomon, 2011). In spite of the interdependency of values, many studies have treated underlying dimensions of the values as being independent (Schwartz, 1994). However, Schwartz and Bilsky (1987) specified a set of dynamic relations among the motivational types of values in an integrated manner on the basis of Rokeach s value system (Schwartz, 1994). They indicated values as concepts or beliefs about desirable end states or behaviors that transcend specific situations, guide selection or evaluation of behavior and events, and are ordered by relative importance (Schwartz, 1994, p. 551). These features enable one to distinguish values from related concepts, such as attitudes and needs. Types of Schwartz Values The Schwartz values consist of 56 items, and these values are categorized into 10 value types: universalism, benevolence, tradition, conformity, security, power, achievement, hedonism, stimulation and self-direction. The existence of these 10 value types has been empirically validated in more than 65 countries (Lindeman & Verkasalo, 2005; Ma & Lee, 2012; Schwartz, 2003). Based on satisfying universal human demands, including biological, social interactional, and social institutional needs, each value type has a distinctive motivational goal derived from different human needs (Schwartz & Bilsky, 1987; Schwartz, 1992). Specifically, universalism values are oriented to all people and nature, aiming at understanding and appreciation for the welfare of all. Similarly, benevolence values focus 37
50 on others, but more narrowly; these values are concerned with intimate others in social interaction. Tradition values are to respect and accept existing ideas in a society, and conformity values are to help a society or group to run smoothly. Power values are derived from the human needs for dominance and control, and the central goal of these values is to gain prestige, dominance, or wealth over others. Achievement values focus on personal success with competence in the perspective of social standards, not internal competence. Though both power and achievement enhance social esteem, power values are dormant by focusing on the preservation of the dominance, while achievement values are related to active seeking for the enhancement of competence. Hedonism values result from the needs for pleasure and enjoyment, and stimulation values are derived from needs for variety and thrilled seeking. The goal of self-direction values is independence through control and mastery. Table 3 summarizes the 10 types of Schwartz values with definitions and examples. 38
51 Table 3. Schwartz Value Types Value Types Definition Examples Universalism Benevolence Tradition Conformity Security Power Achievement Hedonism Stimulation Self-direction Understanding, appreciation, tolerance, and protection for the welfare of all people and for nature Preservation and enhancement of the welfare of people with whom one is in frequent personal contact Respect, commitment, and acceptance of the customs and ideas that traditional culture or religion impose on the self Restraint of actions, inclinations, and impulses likely to upset or harm others and violate social expectations or norms Safety, harmony, and stability of society, of relationships, and of self Social status and prestige, control or dominance over people and resources Personal success through demonstrating competence according to social standards Pleasure or sensuous gratification for oneself Excitement, novelty, and challenge in life Independent thought and actionchoosing, creating, exploring Source. Modified from Bilsky & Schwartz (1994). p Social justice, broadminded, world at peace, wisdom, a world of beauty, unity with nature, protecting the environment, equality Help, forgiving, honest, loyal Accepting my portion in life, devout, respect for tradition, humble, moderate Obedient, self-discipline, politeness, honoring parents and elders Family security, national security, social order, clean, reciprocation of favors, sense of belonging Social power, wealth, authority, preserving public image Successful, capable, ambitious Pleasure, enjoying life Daring, a varied life, an exciting life Creativity, freedom, curious, independent, choosing own goals Structure of Schwartz Value Types Schwartz values demonstrate cohesive relationships among the 10 value types. As seen in Figure 3, the 10 value types form a continuum with the shared motivational goals of adjacent value types (Table 4), which are organized by compatibilities and contradictions (Schwartz & Bilsky, 1987; Schwartz, 1994). Compatible value types are 39
52 positioned proximately around the circle with more overlap in meaning, whereas contrasting value types are in opposing directions from the center. In other words, the closer values have more similar motivational goals, and the more distant values have less similar motivational goals. Therefore, the opposite directions of competing value types establish two bipolar dimensions. These bipolar dimensions are fundamental in the Schwartz value structure. For example, Self-enhancement consists of power, achievement, and hedonism value types, whereas Self-transcendence consists of universalism and benevolence value types. This bipolar dimension indicates the contrast between Self-enhancement, the extent to which they motivate people to enhance their own personal interests (Schwartz, 1992, p. 43) and Self-transcendence, the extent to which they motivate people to transcend selfish concerns and promote the welfare of others, close and distant, and of nature (Schwartz, 1992, p. 44). The other bipolar dimensions are Openness to change and Conservation dimensions. Self-direction, stimulation, and hedonism value types indicate Openness to change, and security, conformity, and tradition value types indicate the Conservation dimension. This bipolar dimension also explains the contrast between Openness to change, the extent to which they motivate people to follow their own intellectual and emotional interests in unpredictable and uncertain directions (Schwartz, 1992, p. 43) and Conservation, the extent to which they motivate people to preserve the status quo and the certainty it provides in relationships with close others, institutions and traditions (Schwartz, 1992, p. 43). Empirical studies have found the duality of hedonism, which belongs to both the Openness to Change and Self-enhancement dimensions. 40


53 Figure 3. Schwartz Value Structure Source. Modified from Schwartz (1992). p. 45. Table 4. Shared Motivations of Adjacent Schwartz Value Types Adjacent Value Types Universalism Benevolence Benevolence Conformity Benevolence Tradition Conformity Tradition Tradition Security Conformity Security Security Power Stimulation Self-direction Self-direction Universalism Source. Developed based on Schwartz (1994). p Shared Motivation Enhancement of others and transcendence of selfish interests Normative behavior that promotes close relationships Devotion to one s in-group Subordination of self in favor of socially imposed expectations Preserving existing social arrangements that give certainty to life Protection of order and harmony in relations Avoiding or overcoming the threat of uncertainties by controlling relationships and resources Intrinsic interest in novelty and mastery Reliance upon one s own judgment and comfort with the diversity of existence 41
54 Given that a personal value serves as a base for the formation of attitudes and leads to behavior and decision making, the following two bipolar dimensions have been largely used in consumer behavior studies. The first bipolar dimension, Self-enhancement and Self-transcendence, has accounted for ethical consumer behavior. Motivated by personal interest, Self-enhancement represents pro-self value orientation, which focuses on optimizing outcomes for oneself. In contrast, as a pro-social value, Self-transcendence tends to focus on optimizing outcomes for others. In ethical consumption studies, Selftranscendence values have been found to be a stronger predictor. For example, Ma and Lee (2012) found that consumers who have experience in buying fair trade products are inclined to have higher Self-transcendence including benevolence and universalism values. That is, they are more concerned about sustainability issues by considering the well-being of others. Also, Pepper, Jackson, and Uzzell (2009) discovered that socially conscious consumption is positively associated with universalism and benevolence, which are associated with Self-transcendence. This type of consumption is negatively related with power and achievement, which are associated with Self-enhancement. For frugal consumption, however, only universalism in Self-transcendence was shown to be significantly related. Other study results also supported that universalism is more influential than benevolence in environmentally friendly consumption (Thøgersen & Ö lander, 2002) and socially responsible consumption (Doran, 2009). These findings revealed that consumers who engage in ethical consumption are trying to support not only those people close to them, but also all people and nature. 42
55 The other bipolar dimension, the Openness to change and Conservation dimension, is useful to explain the adoption of new channel shopping or new styles. For example, Wu, Cai, and Liu (2011) found that a person who has stronger Openness to change orientation is more likely to use the internet in everyday life and to feel the internet is convenient to purchase products online, indicating that the Openness to change orientation facilitates adopting new technology. Wang, Dou, and Zhou (2008) addressed that stimulation needs (i.e., a core value of Openness to change) are satisfied with new products, indicating a positive association between stimulation and consumer innovativeness. Thus, consumers who desire stimulation are likely to have favorable attitudes toward new technology. Contrary to this, consumers who are highly oriented to tradition values, which is a key of the Conservation dimension, may prefer existing products or styles. Steenkamp, Hofstede, and Wedel (1999) also empirically confirmed a negative influence of the Conservation dimension on consumer innovativeness. Likewise, Schwartz value types may be very applicable to the slow fashion orientations. Moreover, since the 10 value types have strong validity and reliability across a number of samples (Schwartz, 1994), this study will utilize the Schwartz value types as a guidance of personal values. Customer Value Creation Framework In recent years, creating superior customer value has become a critical marketing strategy, especially when developing new products or businesses (Anderson, Narus, & Van Rossum, 2006, Holbrook, 1999; Smith & Colgate, 2007). As external market pressure increases, this shift has occurred because controlling internal factors such as 43
56 product quality and organization is not enough to improve a firm s competitive advantage (Woodruff, 1997). Firms that are capable of creating and offering superior value make it possible to position themselves favorably in the market, compared to their competitors (Dasmohapatra, 2005; Holbrook, 1999). Thus, creating superior customer value is necessary to secure a niche in a competitive environment (Day, 1990), and understanding appropriate customer value creation strategies is central in marketing (Smith & Colgate, 2007). Concept of Customer Value The term customer value refers to either the return to consumers for the cost they paid, or the return to companies for the cost they invest in an exchange (Huber et al., 2001; Normann & Ramírez, 1993). In other words, a customer may gain value from a firm s offerings (i.e., customer perceived value or customer received value), or a firm may estimate the value of customers (i.e., valuable customer, customer lifetime value). In this study, the focus of customer value is the value that a consumer obtains from a firm. Customer value is a different concept from personal values, such as the Schwartz values explained earlier. In marketing studies, however, many authors have acknowledged the difficulties of exactly defining customer value due to the subjectivity and ambiguity of value (Khalifa, 2004; Parasuraman, 1997; Smith & Colgate, 2007; Woodruff, 1997). Thus, based on an analysis of commonalities in the literature, this study provides three characteristics of customer value that manifest its difference from personal values. First, customer value is comprised of a cost and benefit concept (Zeithaml, 1988). Customer value may refer to low price, focusing on costs, or whatever the consumer 44
57 received from products or services as benefits. In addition, value can be defined as the quality I get for the price I pay. Broadly, value may encompass what I get (i.e., benefits, quality, worth, utility) for what I give (i.e., price, costs, sacrifices), including all relevant benefits and costs. In this sense, the most widely accepted notion is that customer value derives from a tradeoff between the benefits and the costs (Day, 1990; Lai, 1995; Ulaga & Chacour, 2001). Second, a number of studies have viewed customer value in perceptual terms that are judged by the consumer based on their subjective evaluation for the product/service s desirability, usefulness, or importance (Holbrook, 1999, Huber et al., 2001; Parasuraman, 1997; Sweeney & Soutar, 2001; Woodruff, 1997). In fact, it is not clear whether customer value results from a sum or a ratio of benefits and costs, or whether it is based on compensatory or non-compensatory decision rules (Parasuraman, 1997). For example, Woodruff (1997) stated that customer value is a customer s perceived preference for, and evaluation of, those product attributes, attribute performances, and consequences arising from use that facilitates (or blocks) achieving the customer s goals and purposes in use situation (Woodruff, 1997, p. 142). This definition is broader than a monetary and economic approach of benefit-cost. Third, customer value is an outcome of comparison with a firm s competitors. With emphasis on relative characteristics, Holbrook (1999) described that customer value is determined by an interaction between an object and a subject, and it is associated with an individual s situation-specific comparison of one to another. Smith and Colgate (2007) indicated that customer value is distinctively perceived by individual customers, and is 45
58 conditional or contextual depending on the individual, situation, or product type. Therefore, a consumer s perceived customer value can be changed by available alternatives. In sum, embracing the three characteristics of customer value, this study defines customer value as a consumer s comparative perception and evaluation of benefits derived from a firm s offering for costs paid. Table 5. A Comparison between Customer Satisfaction and Customer Value Customer Satisfaction Customer Value Affective construct (e.g., Like/dislike) Cognitive construct (e.g., Benefit/cost) Post-purchase perspective Pre-/post-purchase perspective Current customer oriented Current and potential customer oriented A firm s offerings focused A firm s and its competitors offerings focused Source. Modified from Eggert & Ulaga (2002). p.110. It is worth noting that customer value is different from customer satisfaction (Sweeney & Soutar, 2001; Ulaga & Chacour, 2001; Woodruff, 1997). Table 5 summarizes a comparison between customer satisfaction and customer value. According to Woodruff (1997), customer satisfaction is mainly determined by a comparison between expected value and actual value. This principle is consistent with the expectation confirmation theory (Oliver, 1977). That is, customers evaluate product attributes and product performance on the basis of expectations or desires. When the actual performance is equal to (i.e., confirmation) or exceeds (i.e., positive disconfirmation) the expectations, customers may be satisfied with the products or firms. On the contrary, if the performance does not meet the expectations (i.e., negative disconfirmation), customer satisfaction may not occur. Therefore, customer satisfaction can occur after a purchase; 46
59 however, since customer value can be evaluated regardless of usage timing, it can occur before, during, or after use of the product (Eggert & Ulaga, 2002; Woodruff, 1997). Another difference is that customer satisfaction depends on a firm s performance evaluated by current customers; thus, it provides guidelines to enhance current performance (Gale, 1994). However, customer value is oriented to potential customers as well as to existing customers (Eggert & Ulaga, 2002). Also, customer value should consider competitors and their offerings to better meet customers needs. Customer Value Creation This section reviews previous studies related to how a firm creates and maximizes customer value. Customer value results from a tradeoff between perceived benefits and perceived costs: Customer alue Perceived enefits Perceived Costs Perceived benefits involve not only physical attributes, but also service attributes (Monroe, 1990). A consumer may perceive products as a bundle of benefits in that products have features, styles, symbolism, durability, quality, and related services with a basic function (Lai, 1995). The costs considered by a consumer may include money, time, risks, and human energy (Lai, 1995). When total perceived benefits outweigh the total perceived costs, customer value is generated, which leads to a purchase decision (Khalifa, 2004). Therefore, to increase customer value, a firm may try to reduce relevant costs or improve the benefits (Day, 1990). 47
60 More specifically, Anderson et al. (2006) provided three customer value propositions in an exchange of business to business (Table 6). Although these propositions were developed in a business market setting, the key idea deems applicable to the consumer market. The first proposition is to increase all possible benefits; thus, this perspective does not require knowledge about customers and competitors. A firm only needs to focus on enhancing the performance of its offerings. Second, when a customer has an alternative, a firm may focus on making all different aspects of favorable and superior offerings to those of the competitors. However, this approach does not guarantee whether all different points deliver truly different values to the target customers. In this sense, the third approach may be very effective: a firm focuses on the few elements of difference that matter most to the target customers based on a sophisticated understanding of the target customers. By substantiating key benefits and costs that make the offerings outstanding, instead of identifying all possible benefits and costs perceived by customers (Smith & Colgate, 2007), an effective resource allocation becomes possible (Anderson et al., 2006). A narrowly defined target consumer, however, will be required for a successful customer value creation strategy (Smith & Colgate, 2007), because benefits and costs are evaluated by customer perception. Each person may evaluate the same product differently based on situations and personal states, such as values or needs (Ravald & Grönroos, 1996). In conclusion, with appropriate target markets and in order to create customer value for competitive advantages, slow fashion brands should identify key distinctions that fast fashion brands cannot achieve and that consumers really value. 48
61 Table 6. Three Approaches for Customer Value Creation All Benefits All Favorable Points of Difference The Most Favorable Points of Difference Proposition Construct Requirements Why should customers purchase a firm s offering? All benefits customers receive from a firm s offering Knowledge of a firm s offering Why should customers purchase a firm s offering instead of competitors? All favorable points of difference a firm s offering has relative to the next best competitors Knowledge of a firm s offering and competitors Source. Modified from Anderson, Narus, & Van Rossum (2006). p. 4. What is most worthwhile for customers to keep in mind about a firm s offering? The one or two points of difference whose improvement will deliver the greatest value to the customer for the foreseeable future Knowledge of how a firm s offering delivers superior value to customers, compared with competitors Outcomes of Customer Value Creation Creating superior customer value enables firms to take advantage of increased profitability. In consumer perspectives, a number of studies have manifested customer satisfaction and loyalty as primary outcomes of customer value creation in various areas. For example, McDougall and Levesque (2000) investigated predictors of customer satisfaction in a service setting and confirmed that core service quality (i.e., benefit) and perceived customer value are the most important antecedents of customer satisfaction, which in turn significantly reduce intention to switch to another firm and increase intention to be loyal to current offerings. Gallarza and Saura (2006) aimed at exploring the relationship among perceived value, satisfaction, and loyalty in tourist behavior. 49
62 Being consistent with the previous study, perceived customer value was a very strong driver of customer satisfaction, which induces loyalty. In an online shopping environment where consumers need to consider additional costs for conveniences such as shipping and return costs, Yang and Peterson (2004) also found that customer perceived value influences customer satisfaction and loyalty. In particular, price premium is a basic indicator of loyalty (Aaker, 1996). Because one of the barriers to purchasing slow fashion items is a relatively high price range, this study posits that a consumer s willingness to pay a price premium may be a fundamental goal for a slow fashion brand to achieve through customer value creation. Price premium is defined as the excess price paid, over and above the fair price that is justified by the true value of the product (Rao & Bergen, 1992, p. 412). Thus, price premium is different from premium prices, which refer to prices that are considerably above average (Rao & Bergen, 1992). Often, the amount a customer will pay for the brand is influenced by comparison with another brand offering (Aaker, 1996). When customers perceive superior value provided by the firm s offerings to competing firms, they may be willing to pay more money for the offerings. Also, the extra amount of payment must be greater than the costs for extra value, because the superior value is likely to result from more input (i.e., costs); thus, slow fashion firms must offer noticeably better products to consumers in the optimal level of increased costs (Day, 1990). By capitalizing on customer value as a tool to be able to meet target consumers expectations (Huber et al., 2001), a firm may successfully sustain profitability as well as competitive advantages. 50
63 Proposed Conceptual Frameworks This dissertation aims to explore the slow fashion movement in theoretical perspectives. However, due to the lack of studies and a formal definition, this study first attempted to identify the underlying dimensions of slow fashion in a preliminary study. With the sub-dimensions of slow fashion, this dissertation examines potential slow fashion consumers and their decision making based on the Schwartz value structure and the customer value creation framework in two parts of studies. Specifically, Study I is designed to identify potential slow fashion consumer segments based on consumer orientation to slow fashion that was found in a preliminary study, and to profile each segment with the Schwartz value, apparel consumption behaviors, and demographics. Study II examines how each of the slow fashion dimensions creates customer value and, subsequently, how the increased customer value affects consumers intention to purchase and pay a price premium for slow fashion goods. As a preliminary study, the dimensions of slow fashion were identified for the better establishment of consumer segmenting in Study I and for the development of hypotheses in Study II. The next section delineates the preliminary study which includes the process and findings of identifying the sub-dimensions of the slow fashion construct, followed by explanations of Study I and Study II in detail. Preliminary Study. Identifying Dimensions of Consumer Orientation to Slow Fashion Following Churchill s (1979) paradigm for developing measurement, the preliminary study was conducted to find the underlying dimensions of slow fashion 51
64 through measuring consumer orientation in relation to slow fashion products and consumption. Figure 4 describes the procedure of the preliminary study: scale item generation and purification. Figure 4. Procedure of the Slow Fashion Dimension Identification SCALE ITEM GENERATION Specify Domain of Construct Extensive literature review Open-ended Survey (n=31) Item Generation Content validity SCALE ITEM PURIFICATIION Survey I: Student Sample (n=121) Exploratory factor analysis Confirmatory factor analysis Chi-square differences test Reliability, construct validity Survey II: Non-student Sample (n=122) Confirmatory factor analysis Reliability, construct validity Scale Item Generation First, in order to identify the domain, an open-ended survey was conducted via the judgment sampling method. The judgment sampling method was employed to recruit persons who could provide ideas of the phenomenon in the survey, as suggested in Churchill s (1979) study. The survey was distributed to 31 university students who were taking a retailing course; it was distributed in a classroom setting with the instructor s permission. Since the students were majoring in consumer and apparel studies, they were expected to be more likely to know about the slow fashion movement than students from other majors. The students were asked to answer the survey voluntarily during the class period. Three open-ended questions were presented: (1) Have you heard about Slow Fashion before?, (2) What would slow fashion be like?, and (3) Do you have any 52
65 experience with slow fashion? The survey provided a very short description of slow fashion to avoid any confusion in respondents who were not familiar with the terminology of the topic. The description read us as follows: Slow fashion aims at designing, producing, consuming and living better by slowing down the fashion cycle, moving from quantity- to quality-based. Slow fashion is not just the opposite of fast fashion, but more sustainable and ethical ways of being fashionable. The concept of slow fashion borrows from the slow food movement, which links pleasure and food with awareness and responsibility. After reading the description above, subjects were asked to write down their opinion in terms of the three questions. Then, the researcher of this study categorized similar answers, and the categories were compared with the slow fashion concept found in the literature. Based on the identified common domains of slow fashion, an initial 69 items to measure consumer orientations related to slow fashion were generated through modifying existing items (Kim & Damhorst, 1998; Tian, Bearden, & Hunter, 2001), and creating new items. The content validity of the initially developed 69 items was examined by both non-experts and experts in the apparel and consumer areas. After deleting or modifying redundant, vague, and misleading items, 43 items were retained. Scale Item Purification The subsequent item refinement procedure was carried out via surveys with student and non-student samples. The survey was approved by the Institutional Review Board of the University of North Carolina at Greensboro. With the student sample, the 43 items of slow fashion orientation were reduced to 15 items with five underlying 53
66 dimensions. Then, the 15-item, five-dimension scale was confirmed by a non-student sample. Student Sample Survey A student sample was recruited at a university in the southeastern region of the U.S. by the convenience sampling method. With permission from the instructor, the survey was distributed in the classroom. A total of 129 students participated in the survey. The items were measured on a 5-point Likert scale (1=strongly disagree to 5=strongly agree), and the final 121 responses were further analyzed after discarding incomplete responses. The student sample was homogeneous in terms of age (Mean=20.08 years old), education, and income level. The majority of the sample was female (89.3% of the total respondents). Regarding ethnicity, Caucasian accounted for 53.3%, and African American accounted for 30.8% of the total respondents. In order to find whether slow fashion orientation items meet the statistical requirement for exploratory factor analysis (EFA), correlations of the data matrix, Bartlett test of spherictiy, and measure of sampling adequacy (MSA) through the Kaiser- Meyer-Olkin (KMO) measure were examined. A number of correlation coefficients were greater than 0.30, and the Bartlett test of sphericity was significant (χ 2 = , df= 903, p< 0.000). Moreover, the KMO measure was These results indicated that the scale items hold factorability, meaning that they are appropriate to conduct the factor analysis. By the principal components method with varimax rotation, EFA was undertaken with the first surveyed items by IBM SPSS While retaining factors with eigenvalues 54
67 greater than 1.0, and items with factor loadings of 0.40 or more, cross-loading items were disregarded. As a result, the slow fashion construct was explained by five factors: Equity, Authenticity, Functionality, Localism, and Exclusivity (Table 7). A total of 15 items (Cronbach s α= 0.845) accounted for 69.37% of total variance, and each factor had three items. In addition, the items were reliable based on the coefficient alpha. Specifically, the first factor, referred to as Equity (15.52% of variance, Cronbach s α= 0.813), was concerned with fair trade and compensation for producers. The second factor addressed Authenticity (14.93% of variance, Cronbach s α= 0.763), which respects craftsmanship and traditional techniques. The third factor, Functionality (13.50% of variance, Cronbach s α= 0.725), included consideration of the longevity and versatility of clothing. The fourth factor, Localism (12.89% of variance, Cronbach s α= 0.725), indicated a preference toward local and domestic businesses. The final factor, Exclusivity (12.54% of variance, Cronbach s α= 0.731), was related to enjoying uniqueness because of product scarcity. With the five factors found in the EFA, the 15 items were analyzed by the confirmatory factor analysis (CFA) of maximum likelihood estimation in AMOS 21.0 (Table 8). In order to find the goodness-of-fit (GOF) of the model, basic GOF indices, absolute fit indices and incremental fit indices were considered. The GOF tells how well the model reproduces the observed covariance matrix among the indicators. As basic indices of GOF, the χ 2 statistic, the degrees of freedoms (df), and statistical significance of χ 2 were used. Moreover, absolute fit indices are used to evaluate how well the model reproduces the observed data, and this study examined the χ 2 statistic, the normed χ 2 and 55
68 the root mean square error of approximation (RMSEA). Also, incremental fit indices indicate how well the estimated model fits relative to a null model which posits that all observed variables are not correlated. The comparative fit index (CFI) and the tuckerlewis index (TLI) were considered for incremental fit indices. Overall, the estimated model had acceptable threshold (Table 9) in the χ 2 statistic (χ 2 = , df= 80, p> 0.01), the normed χ 2 (χ 2 /df= 1.308), the CFI (0.958), the TLI (0.944), and the RMSEA (0.051) (Hair, Black, Babin, & Anderson, 2009). Also, a significant amount of modification indices were not found in this model. Based on an acceptable threshold of 0.7 in composite reliability (CR) (Bagozzi, Yi, & Phillips, 1991; Hair et al., 2009), all constructs were reliable, ranging from (Exclusivity) to (Equity). For construct validity, convergent validity and discriminant validity were considered. First, convergent validity was supported, given that all standardized factor loadings were greater than 0.5 and the average variance extracted (AVE) values were a proximate to or exceeded 0.5, which is an acceptable magnitude (Bagozzi et al., 1991; Hair et al., 2009). For discriminant validity, the square root of AVE values for any two constructs were compared to the correlation estimate between these two constructs, as suggested by Fornell and Larcker (1981). By finding that the square root of AVE of each pair of constructs was greater than corresponding correlations estimate in all cases, this study confirmed the discriminant validity of the consumer orientation to slow fashion scale in a student sample (Table 10). 56
69 Table 7. Exploratory Factor Analysis of Consumer Orientation to Slow Fashion: A Student Sample (N=121) Factor 1 Equity Factor2 Authenticity Factor 3 Factor 4 Functionality Localism Factor 5 Exclusivity 1. I am concerned about the.821 working conditions of producers when I buy clothes. 2. I am concerned about fair.794 trade when I buy clothes. 3. Fair compensation for apparel.789 producers is important to me when I buy clothes. 4. Craftsmanship is very.789 important in clothes. 5. Handcrafted clothes are more.768 valuable than mass-produced ones. 6. I value clothes made by.728 traditional techniques. 7. I tend to keep clothes as long.864 as possible rather than discarding quickly. 8. I often enjoy wearing the.802 same clothes in multiple ways. 9. I prefer simple and classic.691 designs. 10. I prefer buying clothes made.810 in U.S. to clothes manufactured overseas. 11. I believe clothes made of.780 locally produced materials are more valuable. 12. We need to support U.S..678 apparel brands. 13. I enjoy having clothes that.843 others do not. 14. Limited editions hold.726 special appeal for me. 15. I am very attracted to rare.688 apparel items. Eigenvalue % of Variance Cumulative % Cronbach s α Note. Varimax rotation 57
70 Table 8. Confirmatory Factor Analysis of Consumer Orientation to Slow Fashion: A Student Sample (N=121) Standardized estimate Standard error t-value Equity (Cronbach s α=.813, CR a =.826, AVE b =.607) X 1 : I am concerned about the working conditions of producers when I buy clothes. X 2 : I am concerned about fair trade when I buy clothes * X 3 : Fair compensation for apparel producers is important to me when I buy clothes * Authenticity (Cronbach s α=.763, CR=.764, AVE=.523) X 4 : Handcrafted clothes are more valuable than massproduced ones. X 5 : Craftsmanship is very important in clothes * X 6 : I value clothes made by traditional techniques * Functionality (Cronbach s α=.725, CR=.747, AVE=.488) X 7 : I tend to keep clothes as long as possible rather than discarding quickly. X 8 : I often enjoy wearing the same clothes in multiple * ways. X 9 : I prefer simple and classic designs * Localism (Cronbach s α=.725, CR=.750, AVE=.509) X 10 : I believe clothes made of locally produced materials are more valuable. X 11 : I prefer buying clothes made in U.S. to clothes * manufactured overseas. X 12 : We need to support U.S. apparel brands * Exclusivity (Cronbach s α=.731, CR=.697, AVE=.478) X 13 : Limited editions hold special appeal for me X 14 : I am very attracted to rare apparel items * X 15 : I enjoy having clothes that others do not * Model fit. χ 2 = (df=80, p=.034), χ 2 /df=1.308; CFI=.958, TLI=.944, RMSEA=.051 Note. a Composite reliability, b Average variance extracted, * p<
71 Table 9. Acceptable Thresholds for Model Fit Indices (N< 250) χ 2 m a m< 30 m 30 Insignificant p-values expected Significant p-values even with good fit Significant p-values expected CFI, TLI Above.97 Above.95 Above.92 RMSEA Below.08 Below.08 Below.08 Normed χ 2 χ 2 :df=3:1 or less Note. a m denotes the number of observed variables. Source. Hair, Black, Babin, & Anderson (2009) Table 10. Mean, Standard Deviation, and Correlations of Consumer Orientation to Slow Fashion: A Student Sample (N=121) Correlations Mean SD Equity Authenticity *** Functionality * Localism ***.441***.250** Exclusivity ***.436***.277**.335***.691 Note. The lower triangle of the matrix represents the correlation coefficients between constructs. The diagonal values represent the square root of the average variance extracted of each construct. * p< 0.05, ** p< 0.01, *** p< A χ 2 difference test was also conducted between the five-factor model and a single-factor model (Figure 5) since correlations among latent constructs were moderate or high as shown in Table 3. The χ 2 difference statistic can test either the statistical significance of the decrement in overall fit when free parameters are eliminated or the improvement in overall fit as free parameters are added (Kline, 2011). Compared to the five-factor model, the one-factor model had a reduced number of free parameters. In this 59
72 2 case, the larger value of χ D rejects the equal-fit-hypothesis between the two models, which means the reduced free parameter model is oversimplified (Kline, 2011). The χ 2 difference test between the five-factor model (χ 2 = , df= 80) and the one-factor model (χ 2 =296.97, df= 90) revealed that the five-factor model had a better fit than a single-factor model for the data (χ 2 D = , df D = 10) at 0.05 level (χ 2 crit = 18.31, df= 10). To conclude, the slow fashion orientation construct consists of five dimensions: Equity, Authenticity, Functionality, Localism, and Exclusivity. Figure 5. A Single-factor Model and Five-factor Model of the Slow Fashion Orientation Non-student Sample Survey For further refinement and a reliability check of the 15 items, the second survey was conducted with a non-student sample that was heterogeneous (Table 11). Focusing on the southeastern region of the U.S., people in public places, such as parks and the rest area of shopping malls, were asked to fill out the survey, and 126 volunteers took part. After screening out student participants and incomplete answers, 122 responses were analyzed. 60
73 Table 11. Sample Descriptions: A Non-student Sample (N=122) Gender Age Ethnicity n % n % Male Female High school and less N/A The Some college Highest Bachelor Education Master Ph.D N/A and over N/A Caucasian $20,000 and less African $20,001-40, American Annual $40,001-60, Asian Income $60,001-80, Hispanic $80,001 and more Mixed N/A N/A 0 0 With AMOS 21.0, the CFA of maximum likelihood estimation was conducted. The χ 2, the normed χ 2, the CFI, the TLI, and the RMSEA were considered for the model fit (Table 12). As a result, the χ 2 test was significant (χ 2 = , df= 80, p< 0.001), rejecting the exact-fit hypothesis. However, since χ 2 statistic is sensitive to sample size (Hair et al., 2009), other model fit indices confirmed a satisfactory model fit (χ 2 /df= 1.715, CFI= 0.904, TLI= 0.874, RMSEA= 0.077). Moreover, all constructs were reliable, measuring around or exceeding 0.70 of the composite reliability, which indicates adequate internal consistency. Regarding the convergent validity, the Functionality dimension seemed to be problematic by having a lower AVE value (0.383) than the acceptable magnitude of 0.5 (Bagozzi et al., 1991; Hair et al., 2009). This may be because the versatility item (X 9 ) had a relatively low factor 61
74 loading (0.393). However, the other dimensions held convergent validity with an adequate magnitude of AVE, ranging from (Exclusivity) to (Equity). In addition, the square root AVE estimates of any two constructs were greater than the correlation estimates between these two constructs in all cases, supporting discriminant validity (Table 13). The results of CFA with the non-student sample confirmed the five factors with 15 items (i.e., Equity, Authenticity, Functionality, Localism, and Exclusivity) of the student sample survey. Taking all of these results into account, the five-dimension scale, comprised of 15 items, was fairly reliable and valid across the two different samples. Through the data, these results clearly demonstrate that slow fashion can be defined by Equity, Authenticity, Functionality, Localism, and Exclusivity. In the main survey, the five dimensions of the 15 items will be validated. 62
75 Table 12. Confirmatory Factor Analysis of Consumer Orientation to Slow Fashion: A Non-student Sample (N=122) Standardized estimate Standard error t-value Equity (Cronbach s α=.819, CR a =.833, AVE b =.626) X 1 : I am concerned about the working conditions of producers when I buy clothes. X 2 : I am concerned about fair trade when I buy clothes * X 3 : Fair compensation for apparel producers is important to me when I buy clothes * Authenticity (Cronbach s α=.746, CR=.764, AVE=.505) X 4 : Craftsmanship is very important in clothes X 5 : I value clothes made by traditional techniques * X 6 : Handcrafted clothes are more valuable than massproduced ones * Functionality (Cronbach s α=.670, CR=.702, AVE=.383) X 7 : I tend to keep clothes as long as possible rather than discarding quickly. X 8 : I prefer simple and class designs * X 9 : I often enjoy wearing the same clothes in multiple ways * Localism (Cronbach s α=.786, CR=.736, AVE=.586) X 10 : We need to support U.S. apparel brands X 11 : I prefer buying clothes made in U.S. to clothes * manufactured overseas. X 12 : I believe clothes made of locally produced materials are more valuable * Exclusivity (Cronbach s α=.742, CR=.687, AVE=.498) X 13 : I am very attracted to rare apparel items X 14 : Limited editions hold special appeal for me * X 15 : I enjoy having clothes that others do not * Model fit. χ 2 = (df=80, p=.000), χ 2 /df=1.715; CFI=.904, TLI=.874, RMSEA=.077 Note. a Composite reliability, b Average variance extracted, * p<
76 Table 13. Mean, Standard Deviation, and Correlations of Consumer Orientation to Slow Fashion: A Non-student Sample (N=122) Mean SD Correlations Equity Authenticity ** Functionality **.274* Localism **.320**.341** Exclusivity * Note. The lower triangle of the matrix represents the correlation coefficients between constructs. The diagonal values represent the square root of the average variance extracted of each construct. * p< 0.01, ** p< Study I. Profiling Potential Slow Fashion Consumers The primary purposes of Study I were (1) to classify consumer segments based on the dimensions of consumer orientation to slow fashion, and (2) to profile each segment with personal values, apparel consumption behaviors and basic demographic information. Especially, since personal values serve as a base for the formation of attitudes and lead to behavior and decision making, understanding consumers personal values is fundamental to define a specific segment where appropriate marketing strategies are employed accordingly (Huber et al., 2001). Also, since an individual may seek different product attributes by personal values that guide consumer behavior and decision making, profiling consumers by personal values is critical in marketing (Doran, 2009). This study employed ten types of the Schwartz value to assess personal value. Figure 6 illustrates the conceptual framework of Study I. 64
77 Figure 6. Proposed Conceptual Framework of Study I Study II. Structural Equation Modeling to Test Hypothetical Relationships The objectives of Study II were to find (1) how each dimension of slow fashion contributes to creating customer value toward slow fashion, and (2) whether perceived customer value increases a consumer s intention to purchase and pay a price premium for slow fashion products. Built on the customer value creation framework, Figure 7 describes the proposed conceptual framework for the hypothetical relationships among constructs, including each slow fashion dimension, perceived customer value toward slow fashion, a consumer s purchase intention and willingness to pay a price premium for slow fashion products. As the customer value creation framework posited that the superior value of firms offerings derived from key benefits and costs leads to positive marketing outcomes from customers (Anderson et al., 2006; Smith & Colgate, 2007), the hypothetical relationship proposed that a consumer would perceive increased customer value when slow fashion offerings deliver superior value to fast fashion products that meet his or her needs. The increased customer value, in turn, would result in increasing 65
78 intention to buy the product and pay more in spite of the higher pricing of slow fashion over fast fashion products. Following are the details of the seven hypotheses proposed in the framework. Figure 7. Proposed Conceptual Framework of Study II Influences of Slow Fashion Orientations on Perceived Customer Value In the preliminary study, the first consumer s orientation relevant to slow fashion was Equity. This addressed that slow fashion products should be equally accessible to everyone through fair trade, and producers should be respected and compensated accordingly. With workers being freed from excessive workloads, better working conditions should be secured in a slow production system. Since workers in apparel manufacturing suffer from lower payment than living wages and sweatshop conditions (Clark, 2008), the equity issues of workers have been advocated for decades. A worldwide cost competition has resulted in higher demands for outsourcing at a lower cost of labor, and the fierce cost competition overlooks equity for workers. 66
79 One of the philosophies of slow fashion is that products are made ethically (Fletcher, 2008). The low speed production system of slow fashion guarantees regular working hours and lessens excessive workloads, meaning that producers can work in better conditions, and thereby enhance their quality of life. Slow fashion engages in campaigns or codes of conduct such as the Asian floor wage alliance, the ethical trading initiative, and the fair wear foundation to maintain fair treatment of workers (Dickson, Cataldi, & Grover, 2013; Fletcher, 2008). Moreover, with slow fashion it is possible to retain a more transparent supply chain in small scales or local communities with fewer or no intermediaries (Clark, 2008). For example, as discussed previously, Raleigh Denim is run by a husband and wife design team and local artisans. The brand handles the whole production process, from initial design to finishing, under one roof located in downtown Raleigh, North Carolina. Eventually, fair trade becomes achievable in slow fashion. Therefore, people who are more likely to be concerned about producers via fair compensation and working environment would perceive increased value toward slow fashion products. In this sense, H1 was proposed: H1. A consumer who is concerned with Equity will perceive customer value toward slow fashion products. The second slow fashion orientation identified in the preliminary study was Authenticity. Slow is not just the opposite of fast; instead, value is added to products when the production process is slowed down. In fact, rapid production in the fast fashion system results in lower quality due to poor garment construction. Even worse, since the aim of fast fashion is to provide fashion trends cheaply, and rapidly, fast fashion brands 67
80 are likely to use cheap materials and labor. Thus, the products are not durable for multiple launderings, and therefore have a shorter usable lifespan. The main focus of slow fashion, therefore, is to make people buy fewer garments but ones of a higher quality. In order to enhance product quality, slow fashion may be oriented to highly skilled and craft-based production (Cooper, 2005). This aspect of slow fashion is well identified in the Authenticity dimension of slow fashion. Instead of industrial machines, the slow fashion production system may capitalize on original shuttle looms and traditional construction methods. Also, hand craftsmanship allows for a story on the items through richer interaction with workers. In a slow production system, they can spend longer on each part of a garment. Compared to easily copied commodities, the craftsmanship improves product quality, enabling the product to last longer. High quality and hand craftsmanship should be more favorable to consumers who really care about Authenticity of apparel items, and these consumers would perceive value in slow fashion products. Therefore, H2 was proposed: H2. A consumer who is concerned with Authenticity will perceive customer value toward slow fashion products. The third dimension, Functionality, was related to maximizing the utility of the fashion product. That is, slow fashion encourages people to wear high quality items for longer, more often, and in multiple ways. This is in sharp contrast to a fast fashion consumption loop that shortens the lifecycle of individual styles. Fast fashion promotes being fashionable through a number of fashion item purchases that catch fast-changing fashion trends (Watson & Yan, 2013). Leading to perishable fashion clothes, fast 68
81 fashion businesses deliberately shorten the product lifespan of apparel (Byun & Sternquist, 2008); thereby, people are likely to buy multiple clothes at once and discard them shortly (Fletcher, 2010), which is why fast fashion is criticized in terms of sustainability. By supporting the idea of buying less clothing and wearing it longer, slow fashion may be a more sustainable pattern as it reduces resource consumption and the amount of waste. To achieve slow consumption, following the fashion trends is replaced by classic designs that consumers can wear through one or more fashion seasons. Also, slow fashion involves enjoyment of fashion by wearing an item in multiple ways, which enhances efficacy of product usage (Johansson, 2010). Consumers may perceive that the increased longevity and versatility of a product can be more economical than fast consumption even in spite of the higher product price of slow fashion. Likewise, a consumer s propensity toward longevity and versatility of a piece of clothing may be perceived as a customer value for slow fashion over fast fashion. H3 was proposed as follows: H3. A consumer who is concerned with Functionality will perceive customer value in slow fashion products. The fourth dimension of slow fashion orientation that was identified in the preliminary study was Localism. Slow fashion products are generally produced in local venues with local resources, such as skilled artisans, local factories, or locally produced raw materials. For this reason, slow fashion contributes to not only supporting local businesses, but also to keeping a local identity by connoting specific local culture in the products (Clark, 2008). In the same way that local food varies from region to region, 69
82 localized apparel production helps to diversify the fashion world rather than having styles driven by fashion trends, which are often standardized and identical across countries. Importantly, the Localism dimension found in the preliminary study is a broader concept than local communities, expanding to a preference for domestic brands over global apparel brands. In fact, due to heavy reliance on overseas manufacturing, the import penetration rate in the U.S. apparel market is extremely high. However, according to the Cotton Incorporated Environment Survey (2013), over 65% of respondents show a desire for made-in-the-usa apparel. Slow fashion may satisfy the need to support local and domestic firms. Thus, consumers who are concerned about Localism would perceive more value in slow fashion than fast fashion, and H4 was proposed: H4. A consumer who is concerned with Localism will perceive customer value in slow fashion products. The fifth dimension of slow fashion orientation identified in the preliminary study was Exclusivity. Slow fashion items are produced in small quantities (Cline, 2012) because they are not made by industrial machines. Therefore, slow fashion items do not look precisely identical, even in the same batch. In slow production, a richer interaction between producers and products is allowed, so every item has its own story. By contrast, fast fashion follows transitory trends and focuses on visual images under standardized mass production. In the mass produced fast fashion cycle, consumers may lose chances to express themselves (Johansson, 2010; Kim, Choo, & Yoon, 2013). Although fast fashion retailers display a substantial number of styles, they follow high-end fashion designers rather than being genuine, and products are likely to be standardized and homogenized. 70
83 In other words, fast fashion lacks diversity, and is associated with little opportunity for self-expression (Johansson, 2010). Some people criticize the deindividualization of fast fashion; that is, creativity is missing in the products and almost everyone purchases the same fast fashion products (Kim et al., 2013, p. 248). However, diverse fashion is available through heterogeneous fashion items in small quantity based slow fashion, which delivers Exclusivity to the individual (Clark, 2008). Allowing the expression of personal tastes, slow fashion can appeal to individuals who want to differentiate themselves from others and achieve fashion uniqueness. Therefore, H5 was proposed: H5. A consumer who is concerned with Exclusivity will perceive customer value in slow fashion products. Influence of Perceived Customer Value on Purchase Intention and Willingness to Pay a Price Premium As stated, a pair of Raleigh Denim jeans is sold at about $300. Generally, the higher cost of garments is inevitable for products with high quality, craftsmanship, and sustainability (Clark, 2008; Pookulangara & Shephard, 2013). Given that slow fashion items are high quality, produced in a slow manner, and in small quantities, the product prices tend to be higher than commodities from mass production. Moreover, in order to guarantee a fair wage for workers, the higher pricing of slow fashion may commensurate with the amount of labor to produce the item (Clark, 2008). From the consumer perspective, slow fashion items require extra costs for higher quality, whereas fast fashion products are perceived as affordable pricing for low quality (Watson & Yan, 71
84 2013). Therefore, this study posited that the higher price range of slow fashion is a primary concern to be resolved for sustainable profitability of slow fashion firms. According to the customer value creation framework, firms that are capable of creating and providing customers with superior value may acquire a more favorable position than competitors in the market. Consequently, the firms may take advantage of enhanced profitability via customer satisfaction and loyalty (Day, 1990). In particular, a review of the literature suggested that customer loyalty, including intention to purchase, retain, recommend, and pay more, is an integral outcome of customer value (Dasmohapatra, 2005; Day, 1990; Khalifa, 2004). In a slow fashion context, a greater customer value would increase opportunities for not only purchase, but also price premium. When consumers consider that slow fashion products convey significantly higher benefits, such as satisfying the desire for handcrafted high quality and locally produced clothing (i.e., perceived customer value), consumers will have intention to buy and pay additional costs for slow fashion products. Therefore, H6 and H7 were proposed: H6. A perceived customer value on slow fashion will increase a consumer s purchase intention for slow fashion products. H7. A perceived customer value on slow fashion will increase a consumer s willingness to pay a price premium for slow fashion products. Summary This chapter outlined sustainability, slow fashion and two theoretical foundations (i.e., the Schwartz value and the customer value creation framework). Based on a review of the literature, this study consisted of two studies and proposed a conceptual framework 72
85 for each study. The purpose of Study I was to profile potential slow fashion consumers based on the Schwartz values, apparel consumption behaviors and demographics, and the purpose of Study II was to test hypothetical relationships built on a customer value creation framework. Also, for a theoretical definition of slow fashion, a preliminary study was performed and five underlying dimensions of slow fashion were identified: Equity, Authenticity, Functionality, Localism, and Exclusivity. Based on these dimensions, hypotheses for Study I and Study II were postulated. The following chapter will describe the research methodology used to investigate the two proposed conceptual frameworks. 73
86 CHAPTER III RESEARCH METHODOLOGY This chapter discusses the research methodology that was used in the following study: (1) Sample and Data Collection, (2) Survey Design and Instrument Development, (3) Pre-test, (4) Statistical Analysis, and (5) Summary. Sample and Data Collection The purpose of Study I was to classify consumer segments based on their slow fashion orientations, and to profile the segments with personal values, apparel consumption behaviors and demographic variables. The consumer profiling required sampling from a general population. Thus, the target population of the sample for this study was U.S. consumers who are over the age of 18. It is noteworthy that one of the dimensions of slow fashion that was found in the preliminary study was Localism. Since a person s local orientation to their community may vary by location and size of the community (Wilson & Baldassare, 1996), the researcher attempted to eliminate any bias of responses from regional differences. Therefore, targeting a nationwide sample in limited time and cost, online consumer panel data of the U.S. general population was purchased from an online research company. Dillman, Smith, and Christian (2008) supported that the consumer panel is a practical way to recruit a general online sample. In addition, since online consumer panel data is based on an online survey method, it enables the survey to reach geographically and demographically diverse participants at a 74
87 slight cost (Andrews, Nonnecke, & Preece, 2003; Wright, 2005; Yun & Trumbo, 2000). Specifically, the online consumer panel sample of this study was drawn from the established panel pool by using the quota sampling method to enhance representativeness of the sample. As a non-probability sampling technique, quota sampling first decides control categories or quotas of population elements. Then, samples are selected based on convenience or judgment so that the sample composition is consistent with that of the population in terms of quota (Malhotra, 2009). For this study, age, gender and geographical location of subjects were used as quotas. That is, the survey invitation e- mail was sent to the targeted subjects who were selected in consideration of age, gender and geographical location. To prevent the sample audiences from taking part in multiple surveys within a short period time, the company strictly limits the number of surveys that each person can participate in. The subjects of the panel pool are allowed to take part in surveys once a week. Also, the online research company monitors the integrity of data by tracking response patterns and response time of participants. Therefore, this study assured the honesty and integrity of the data obtained from this consumer panel. Survey questionnaires were administered in Qualtrics. After the Institutional Review Board of the University of North Carolina at Greensboro approved the study procedure and survey questionnaires, an invitation including the anonymous survey URL was sent to 1,000 samples, which were selected by the quota sampling method in consideration of age, gender, and geographical location. After agreeing to the consent form approved by the Institutional Review Board of the University of North Carolina at Greensboro, the invited subjects were allowed to enter the survey voluntarily. 75
88 Initially, 406 subjects entered the survey. Out of 406 respondents, 400 respondents agreed to the consent form. However, out of the 400 respondents who agreed to the consent question, only 317 respondents started answering the survey. The online survey was available for four days, and finally 221 respondents completed the survey, which yielded a 22.10% response rate (221/1,000= 22.10%). This was acceptable given that the response rates of online panels are typically less than 25% (as cited in Dillman, Smith, & Christian, 2008). Survey Design and Instrument Development The survey questionnaire consisted of (1) consumer orientation to slow fashion, (2) environmental apparel consumption, (3) socially responsible consumption, (4) Schwartz values, (5) apparel consumption behaviors, (6) perceived customer values toward slow fashion products, (7) purchase intention, (8) willingness to pay a price premium, (9) Acceptable price premium, and (10) demographics. The whole questionnaire is presented in Appendix A. The majority of the scales were borrowed or modified from previous literature. Table 14 summarizes detailed information about source and scale of major variables with example items. 76
89 Table 14. Measurement Items, Scales, and the Sources Measures Example Items (Scale) Source Consumer orientation to slow fashion (15 items) Environmental apparel consumption (8 items) I prefer simple and classic designs. I am very attracted to rare apparel items. (1=strongly disagree, 5=strongly agree) I buy apparel made from recycled material. I buy apparel with low impact or no dye processing. (1=strongly disagree, 5=strongly agree) Developed by the author in the preliminary study Borrowed from Kim and Damhorst (1998) Socially responsible consumption (13 items) Schwartz values (56 items) Apparel consumption behaviors - Apparel acquisition (2 items) - Share of purchases with fast fashion (2 items) - Apparel disposal (7 items) Perceived customer values (19 items) Purchase intention (3 items) Willingness to pay a price premium (3 items) Acceptable price premium (1 item) Demographics I try to buy from companies that hire people with disabilities. I avoid buying products made using child labor. (1=strongly disagree, 5=strongly agree) Equality Inner Harmony Social Power Pleasure (1=not important at all, 5=very important) On average, how many apparel products do you purchase in a month?(1=0-1, 5=11+) On average, how much do you spend on clothing in a month? (1=$0-20, 5=$201+) What % of your total clothing is purchased in the fast fashion brands? (0-100%) What % of the total money you spend on clothing purchases in spent for fast fashion brand clothing? When you decide that clothing is no longer of use, what do you do? (1=never, 5=all of the time) Have the item mended Have the item down Compared to fast fashion, you perceive that a slow fashion product. (1=strongly disagree, 5=strongly agree) Has consistent quality. Is one that I would enjoy. I will purchase slow fashion products. There is a strong likelihood that I will buy slow fashion products. (1=strongly disagree, 5=strongly agree) Buying slow fashion products seems smart to me even if they cost more. I would still buy slow fashion products if other brands reduced their prices. (1=strongly disagree, 5=strongly agree) How much more are you willing to pay for slow fashion products compared to the price of fast fashion products? (0= same as fast fashion products, 1= 10% more, 2= 20% more, 3= 30% more, 4= 40% more, 5= 50% more [1.5 times as much], 6= 75% more, 7= 100% more [twice as much], 8= more than twice as much) Age Gender Marital Status Ethnicity Education Annual individual income State of residence (open-ended, categorical, interval scale) Borrowed from Webb, Mohr, and Harris (2008) Borrowed from Schwartz (1992) Developed by the author Developed by the author Modified from Solomon and Rabolt (2004) Modified from Sweeney and Soutar (2001) Modified from Sweeney, Soutar, and Johnson (1999) Modified from Castaldo, Perrini, Misani, and Tencati (2009) Modified from Steenkamp, Van Heerde, and Geyskens (2010) Developed by the author 77
90 Consumer Orientation to Slow Fashion Consumer orientation to slow fashion referred to an individual s apparel consumption orientations related to slow fashion. To identify underlying dimensions of slow fashion, scale items to measure consumer orientation to slow fashion were generated and purified in the preliminary study. In student and non-student sample surveys of the preliminary study, reliability and validity of the measurement were supported. To further validate the measurement in line with Churchill s (1979) scale development procedures, the 15 items developed in the preliminary study will be validated in the main survey. The items were measured by a 5-point Likert scale (1= strongly disagree to 5= strongly agree). To test discriminant validity in the main study, this scale will be further compared with an environmental apparel consumption scale (Kim & Damhorst, 1998) and a socially responsible consumption scale (Webb, Mohr, & Harris, 2008). Environmental Apparel Consumption This study borrowed the Environmental Apparel Consumption scale from Kim and Damhorst s (1998) study. The scale items consisted of concerns about recycling, reduced energy consumption, organic material, and eco-friendly labeling when customers are deciding about apparel purchases. The eight items were measured by a 5-point Likert scale (1= strongly disagree to 5= strongly agree). Example statements of the scale were, I buy apparel made from recycled material, and I buy apparel with low impact or no dye processing. In Kim and Damhorst s study (1998), Cronbach s α of the scale was 0.80, which has an acceptable internal reliability (Nunnally & Bernstein, 1994). 78
91 Socially Responsible Consumption The Socially Responsible Consumption scale was borrowed from Webb, Mohr, and Harris s (2008) study to assess the level of social sustainability in consumption behavior. This scale involved consumers concerns about minors and disabled workers, fair compensation, working environment, and a company s social restoration. With 13 items, reported Cronbach s α of the scale in Webb et al (2008) study was Sample statements included, I try to buy from companies that hire people with disabilities, and I avoid buying products made using child labor. The 13 items were measured on a 5- point Likert scale (1= strongly disagree to 5= strongly agree). Schwartz Values Schwartz values consist of 56 items, which are categorized into ten value types: power, achievement, hedonism, stimulation, self-direction, universalism, benevolence, tradition, conformity, and security. The scale has been empirically validated in more than 65 countries (Schwartz, 2003), and is the most widely accepted in value research (Lindeman & Verkasalo, 2005; Ma & Lee, 2012; Wu et al., 2011). In this study, respondents were asked to rate the importance of each value with the question, How important is each value as a guiding principle in your life? The importance was rated on a 5-point Likert scale (1= not important at all to 5= very important). Apparel Consumption Behaviors Respondents apparel consumption behavior was evaluated by apparel shopping and clothing disposal behavior. Specifically, apparel acquisition behavior was first asked, such as the average number of clothing items purchased in a month and the average 79
92 amount of money spent for clothing purchases in a month. The items were measured with interval scales. Then, to assess the extent of the consumer s perceived dependency on fast fashion, the respondent was asked to evaluate the percentage of clothing and money spent on fast fashion purchases out of the total apparel purchased. To help a respondent s understanding, a short explanation about fast fashion with brand examples was provided as follows. These brands were chosen because they were representative fast fashion brands often mentioned in news articles (e.g., Wahba and Skariachan, 2013; WWD, 2013). The fast fashion concept is that garments are produced fast, sold fast, and thrown away fast. The fast fashion brands include Zara, H&M, Forever 21, and Topshop. To assess consumers clothing disposal behavior, the survey posed When you decide that clothing is no longer of use, what do you do? Based on Solomon and Rabolt s (2004) conceptualization of disposal behaviors, seven disposal options were asked: have the item mended, hand the item down, store the item regardless of usage, donate the item, swap the item, resell the item and discard the item. Each option was evaluated on a 5-point Likert scale (1= never to 5= all of the time). Perceived Customer Values toward Slow Fashion Products To measure perceived customer value toward slow fashion products, Sweeney and Soutar s (2001) PERVAL scale was borrowed. PERVAL was designated to evaluate customers perceptions of the value of a consumer durable good at a brand level (Sweeney & Soutar, 2001, p. 203). This scale was comprised of 19 items, including quality, price, and emotional and social value of a product. The Cronbach s α of the scale 80
93 in Sweeney and Soutar s (2001) study was Each item was measured on a 5-point Likert scale (1= strongly disagree to 5= strongly agree). Since this study defined customer perceived value as a consumer s comparative perception, the question asked, Compared to fast fashion, you perceive a slow fashion product. The example items were has consistent quality., is one that I would enjoy., is reasonably priced., and would help me to feel acceptable. To help respondents understanding, the survey first clarified the concept of slow fashion with a description of slow fashion by literature (Fletcher, 2007). As in the fast fashion description above, examples of slow fashion brands were included based on information obtained from news articles (Phelan, 2012). This study visited the brand websites, and confirmed that the practices implemented in the brands were consistent with the concept used in this study. The description of slow fashion was stated: Slow fashion is to slow down the fashion cycle from fast fashion. That is, the slow fashion concept is that garments are produced slowly and thrown away slowly. The underlying concept of slow fashion is consistent with the slow food movement, which pertains to being aware of the environment and producers by enjoying traditionally and locally made foods. The slow fashion brands are Raleigh Denim, Carrie Parry, Lily Ashwell and Imogene+Willie. Purchase Intention Three items measuring the consumer s purchase intention scale were borrowed from Sweeney, Soutar, and Johnson (1999) and revised into the study s context of slow fashion. The scale included I would consider buying slow fashion products at this store., I will purchase slow fashion products at this store., and There is a strong likelihood that I will buy slow fashion products at this store. Each item was measured on a 5-point 81
94 Likert scale (1= strongly disagree to 5= strongly agree). The three items were reliable in Sweeney et al. s study (1999) by holding 0.95 in Cronbach s α. Willingness to Pay a Price Premium A consumer s intention to pay a price premium for slow fashion products was measured by three items modified from Castaldo, Perrini, Misani, and Tencati s (2009) study. Respondents were asked to answer these three items using a 5-point Likert scale (1= strongly disagree to 5= strongly agree): Buying slow fashion products seems smart to me even if they cost more., I am ready to pay a higher price for slow fashion products., and I would still buy slow fashion products if other brands reduced their prices. In Castaldo et al. s (2009) study, the Cronbach s α value was 0.86, which is a reliable magnitude. Acceptable Price Premium To measure the acceptable amount of price premium, an item from Steenkamp, Van Heerde, and Geyskens s (2010) study was modified. This item measures how much more consumers are willing to pay for slow fashion products compared to the price of fast fashion products. The item was evaluated with a 9-point interval scale (0= same as fast fashion products, 1= 10% more, 2= 20% more, 3= 30% more, 4= 40% more, 5= 50% more [1.5 times as much], 6= 75% more, 7= 100% more [twice as much], 8= more than twice as much). Demographics Respondents demographic information was obtained through categorical scale data. While age question was open-ended, other demographic variables (gender, marital 82
95 status, education, ethnicity, annual individual income, and state of residence) were assessed with categorical and interval scales. Pre-test Before distributing the survey, content validity was examined through a pre-test. The anonymous survey URL was sent to 17 experts and non-experts of apparel and consumer areas. After answering the survey, the researcher asked them whether the survey length, survey flow, and content were acceptable. Based on suggestions, the researcher added images of fast fashion brands and slow fashion brands into the survey to help respondents better understand the concept of fast and slow fashion. The images were retrieved from each brand website or Google image. The images were shown together with the descriptions of the fast fashion and slow fashion concept (Appendix B & Appendix C). Another eight subjects who were not familiar with apparel and consumer areas made sure that the fast fashion and slow fashion concepts were understandable with the images and descriptions. Finally, the survey manager in Qualtrics, who recruited consumer panels and distributed this survey, confirmed that the survey flowed well and that the survey length was appropriate. Statistical Analysis Data was analyzed by IBM SPSS Statistics 21.0 and AMOS Since this dissertation consisted of two studies, detailed information is explained by each part. First, for Study I which intended to profile of potential slow fashion consumers, several statistical techniques were used. Based on a respondent s slow fashion orientations, they 83
96 were classified by a cluster analysis. As suggested by Punj and Stewart (1983), hierarchical clustering was first used to determine an adequate number of clusters. Then, the nonhierarchical method clustered all observations. After finding a significant difference among clusters by analysis of variance (ANOVA) and Tukey post hoc test, each cluster (i.e., segment) was profiled by personal values (i.e., Schwartz value types: universalism, benevolence, tradition, conformity, security, power, achievement, hedonism, stimulation, and self-direction), apparel consumption behaviors, and demographics by ANOVA and crosstabs. Second, the proposed hypotheses in study II were tested by the structural equation modeling (SEM). Following Anderson and Gerbing s (1988) two-step approach, the CFA was first conducted to determine the fit of the measurement model, and construct reliability and validity. Then, hypothetical relationships were tested in SEM. Since SEM examines the structure of interrelationships by estimating multiple regression equations simultaneously (Kline, 2011), the analyzing technique was appropriate for this study to reveal a series of relationships holistically and systematically, rather than indicating several separate relationships between independent variables and dependent variables. Major statistical techniques are summarized in Table
97 Table 15. Major Statistical Techniques Study I: Profiling potential slow fashion consumers Study II: Structural equation modeling for testing hypotheses Major Statistical Technique Classifying consumer segment: Cluster analysis Profiling : ANOVA & Crosstabs Testing measurement model: CFA Testing structural model: SEM Summary This chapter specified the methodology to implement this study. The sample and online survey method were described, and the survey design and instruments to measure each construct was introduced. Major statistical techniques for data analyses were also discussed. In the next chapter, the results of data analysis will be explained. 85
98 CHAPTER IV DATA ANALYSIS AND RESULTS This chapter includes the following information: (1) Sample Description and Nonresponse Bias Tests, (2) Preliminary Analysis, (3) Validating Dimensions of Consumer Orientation to Slow Fashion, (4) Study I: Profiling Potential Slow Fashion Consumers, (5) Study II: Structural Equation Modeling to Test Hypothetical Relationships, and (6) Summary. Sample Description and Non-response Bias Tests Given that 221 respondents completed the survey out of 317 respondents who started answering the survey of this study, a non-response error may have occurred. Especially, when subjects who did not complete the survey are different from those who did, it may undermine representativeness of the target population (Dillman et al., 2008). To check the non-response error, this study compared demographic variables between the 221 respondents who completed the survey and the 96 respondents who stop answering the survey (Armstrong & Overton, 1977). After converting the age variable that was measured by an open-ended question to categorical data, and state of residence was recoded as four geographical locations (i.e., Midwest, Northeast, South and West), all demographic variables were analyzed by crosstabs with χ 2 statistic to confirm whether significant differences between the two groups were found (Table 16). As a result, there were no significant differences in demographic variables (p>.05), implying that the non- 86
99 responses occurred at random. Hence, this study did not regard a number of incomplete responses as being problematic, and decided to use the final 221 completed responses for the analysis. The sample description is summarized in Table 16. The average age of 221 respondents was years old, ranging from 19 to 77. The sample comprised of 113 males (51.13%) and 108 females (48.87%). Also, 115 respondents (52.04%) were married, and 106 (47.96%) were not. The majority of the final sample was Caucasian/Anglo/European American (n= 164, 74.21%), followed by African American (n= 26, 11.76%), Hispanic/Latino (n= 18, 8.14%) and Asian (n= 9, 4.07%). In terms of income, 69 respondents (31.22%) earned $19,999 or less, followed by the amounts of $20,000-39,999 (n= 52, 23.53%), $40,000-59,999 (n=38, 17.19%) and $60,000-79,999 (n= 28, 12.67%). In addition, 79 respondents (35.75%) were found to reside in the South region of the U.S., and 55 respondents (24.89%) lived in the West region of the U.S. With regard to education level, 83 subjects (37.56%) answered that the highest education level they completed was some college, followed by bachelor (n= 63, 28.51%), and high school or less (n=53, 23.98%). To confirm the sample representativeness of the U.S. general population, the compositions of respondents age, gender and geographical location were compared with the most recent U.S. census data (U.S. Census Bureau, 2011). As shown in Table 17, the sample composition was fairly similar to the U.S. population composition in terms of age, gender and geographical location. In terms of age composition, the group between 18 and 44 years of age accounted for over 50%, followed by the years old group, and the 87
100 65 years old and above group in both the sample and census data. In addition, the ratio between male and female was almost half-and-half in the sample and census data, and geographical location composition was very similar across the data. Thus, the sample representativeness was deemed to be supported. 88
101 Table 16. Sample Description and Non-response Test Results Demographic variables Age χ 2 = (df= 5, p>.05) Gender χ 2 = (df= 1, p>.05) Category N of cases (%) Complete (n=221) Incomplete (n=96) Total (n=317) years old 40 (18.10) a 19 (19.79) 59 (18.61) (22.62) 13 (13.54) 63(19.87) (17.65) 21 (21.88) 60 (18.93) (22.62) 27 (28.13) 77 (24.29) (14.93) 12 (12.50) 45 (14.20) 70 and above 9 (4.07) 4 (4.17) 13 (4.10) Male 113(51.13) 42 (43.75) 155 (48.90) Female 108 (48.87) 54 (56.25) 162 (51.10) Marital status Married 115 (52.03) 42 (43.75) 157 (49.53) χ 2 = Unmarried 106 (47.96) 54 (56.25) 160 (50.47) (df= 1, p>.05) Education High school or less 53 (23.98) 32 (33.33) 85 (26.81) χ 2 = Some college 83 (37.56) 37 (38.54) 120 (37.85) (df= 4, p>.05) Bachelor 63 (28.51) 18 (18.75) 81 (25.55) Masters/some 19 (8.60) 7 (7.29) 26 (8.20) graduate school Doctorate 3 (1.36) 2 (2.08) 5 (1.58) Annual individual income χ 2 = (df= 5, p>.05) Ethnicity χ 2 = (df= 5, p>.05) $19,999 or less 69 (31.22) 26 (27.08) 95 (29.97) $20,000-39, (23.53) 27 (28.13) 79 (24.92) $40,000-59, (17.19) 18 (18.75) 56 (17.67) $60,000-79, (12.67) 10 (10.42) 38 (11.99) $80,000-99, (5.43) 7 (7.29) 19 (5.99) $100,000 and above 22 (9.95) 8 (8.33) 30 (9.46) African American 26 (11.76) 15 (15.63) 41 (12.93) American Indian 3 (1.36) 0 (0) 3 (0.95) Asian 9 (4.07) 2 (2.08) 11 (3.47) Caucasian/Anglo/ 164 (74.21) 75 (78.13) 239 (75.39) European American Hispanic/Latino 18 (8.14) 4 (4.17) 22 (6.94) Mixed 1 (0.45) 0 (0) 1 (0.32) Geographical Midwest 46 (20.81) 18 (18.75) 64 (20.19) location Northeast 41 (18.55) 19 (19.79) 60 (18.93) χ 2 = South 79 (35.75) 39 (40.63) 118 (37.22) (df= 3, p>.05) West 55 (24.89) 20 (20.83) 75 (23.66) Note. a The percentage in parenthesis is based on column. 89
102 Table 17. Composition Comparisons between the Sample and U.S. Census Variables Compositions Sample (N=221) U.S. census a (N=209,128,094) Age groups b 18-44years old and above Gender Male Female Geographical Midwest Location c Northeast South West Note. a Under the age of 18 was excluded in the U.S. census to compare the respondents in this study. b The age groups were classified into three groups in accordance with U.S. census data availability. c Geographical location was categorized based on U.S. census. Midwest: IL, IN, IA, KS, MI, MN, MO, NE, ND, OH, SD, WI Northeast: CT, ME, MA NH, NJ, NY, PA, RI, VT South: AL, AR, DE, FL, GA, KY, LA, MD, MS, NC, OK, SC, TN, TX, VA, WV West: AK, AZ, CA, CO, HI, ID, MT, NV, NM, OR, UT, WA, WY Preliminary Analysis Prior to main analyses, this study first examined normality and outliers of data. Also, the CFA was conducted on each major construct of this study, such as environmental apparel consumption, socially responsible consumption, Schwartz values, and perceived customer value. Diagnostics of Normality and Outliers For normality tests, graphical analyses of normality (i.e., histogram, a normal probability plot and a box-plot) and empirical measures of a distribution s shape (i.e., skewness and kurtosis) were used. Particularly, when the skewness value and kurtosis 90
103 value were not greater than ±2.00, the normality of the distribution was regarded as being acceptable (Muthén & Kaplan, 1985). In addition, to detect outliers, this study standardized observations of each item, and examined whether there are standardized values greater than ±2.50 (Hair et al., 2009). As a result, all items were normally distributed by holding a less than ±2.00 value of skewness and kurtosis, and no outlier was detected. The overall diagnostics suggested that normality of data and outliers were not a problem for further analyses. Confirmatory Factor Analysis on Major Constructs Environmental Apparel Consumption The CFA, on eight items of the environmental apparel consumption scale, found one item (i.e., I select apparel that I can wear over a longer term compared to trendy apparel that goes out of style quickly. ) with low factor loading (0.208) and a significant magnitude of modification indices value across multiple items. After deleting the item, a seven-item model was assessed in terms of model fit, reliability and validity (Table 18). The χ 2 statistic was significant (χ 2 = , df= 14, p< 0.05), indicating discrepancies between the data and the model. However, other model fit indices also represented that the model fit the data well (χ 2 /df= 1.984, CFI= 0.982, TLI= 0.973, RMSEA= 0.067). Moreover, the scale was reliable by showing of Cronbach s α, and of composite reliability. The convergent validity was also satisfied through a 0.5 or higher standardized factor loadings and AVE value (0.532). 91
104 Table 18. Confirmatory Factor Analysis of Environmental Apparel Consumption a (Cronbach s α=.871, CR b =.860, AVE c =.532) Standardized estimate Standard error t-value X 1 : I buy clothing made of organically grown natural fibers X 2 : I buy apparel with environmentally friendly labeling or * packaging techniques. X 3 : I buy apparel with low impact or no dye processing * X 4 : I buy apparel made from recycled material * X 5 : I avoid an apparel product because of environmental * concerns. X 6 : I buy second-hand apparel * X 7 : I purposely select fabrics that require cooler washing temperature, shorter drying time, or less ironing * Model fit. χ 2 = (df=14, p<.05), χ 2 /df=1.984; CFI=.982, TLI=.973, RMSEA=.067 Note. a One item ( I select apparel that I can wear over a longer term compared to trendy apparel that goes out of style quickly. ) was deleted. b Composite reliability, c Average variance extracted, * p<.001 Socially Responsible Consumption The socially responsible consumption scale originally had 13 items, but significant amounts of modification indices were found in four items (i.e., I try to buy from companies that help the needy., I try to buy from companies that hire people with disabilities., I try to buy from companies that make donations to medical research., and I make an effort to buy from companies that sponsor food drives. ), and these items undermined the overall model fit; thus, the four items were deleted one by one, and the scale contained nine items. Although the χ 2 statistic of the nine-item model was (df= 27, p<.001), the normed χ 2 statistic was 3.242, which is a nearly acceptable ratio (χ 2 : df = 3:1). Also, the CFI was and the TLI was 0.937, surpassing the acceptable cutoff. The RMSEA was which was regarded as a mediocre fit (MacCallum, Browne, & Sugawara, 1996). However, considering with the satisfactory normed χ 2 92
105 statistic of this scale, absolute fit indices were deemed to be acceptable. The scale was found to be highly reliable by holding of Cronbach s α and of construct reliability. In addition, all standardized factor loadings were 0.5 or higher, and the AVE value was greater than 0.5, supporting convergent validity (Table 19). Table 19. Confirmatory Factor Analysis of Socially Responsible Consumption a (Cronbach s α=.926, CR b =.936, AVE c =.592) Standardized estimate Standard error t-value X 1 : I make an effort to buy products and services from companies that pay all of their employees a living wage. X 2 : When I am shopping, I try to buy from companies that * are working to improve conditions for employees in their factories. X 3 : When given a chance to switch to a brand that gives * back to the community, I take it. X 4 : I avoid buying products or services from companies that * discriminate against women. X 5 : I try to buy companies that support victims of natural * disasters. X 6 : When given a chance, I switch to brands where a portion * of the price is donated to charity. X 7 : When given a chance to switch to a retailer that supports * local schools, I take it. X 8 : I avoid buying products or services from companies that * discriminate against minorities. X 9 : I avoid buying products made by using child labor * Model fit. χ 2 = (df=27, p<.001), χ 2 /df=3.242; CFI=.952, TLI=.937, RMSEA=.101 Note. a Four items ( I try to buy from companies that help the needy., I try to buy from companies that hire people with disabilities., I try to buy from companies that make donations to medical research., and I make an effort to buy from companies that sponsor food drives. ) were deleted. b Composite reliability, c Average variance extracted, * p<
106 Schwartz Values Since this study measured personal values by using the Schwartz values which contain 10 value types, the 56 items of 10 dimensions of the Schwartz value model were analyzed by the CFA to ensure how well the model fit the data of this study (Table 20). As a result, very low standardized factor loadings were found in three items, including social order (0.210), reciprocation of favors (0.204) and detachment (0.178). Given that the square of a standardized factor loading represents the variance extracted, a 0.5 or lower standardized loading undermined the amount of variation in an item explained by the latent factor (Hair et al., 2009). Since the standardized factor loadings of the three items were much below 0.5, they were deleted. Moreover, significant amounts of modification indices were found in several items. In consideration of the conceptual meaningfulness of the item as well as the amount of modification indices, this study regarded six items (i.e., preserving my public image, obedient, intelligent, capable, a spiritual life, and sense of belonging) as being problematic. In fact, modification indices are important to detect problematic items such as cross-loadings (Hair et al., 2009). Considering that 56 items of the Schwartz values structured a continuum that shared motivational goals across items, the modification indices indicated heavily cross-loaded items; thus, the items were also deleted. As a result, the Schwartz value variable contained a total number of 47 items with 10 dimensions. Several model fit indices assessed the goodness-of-fit of the model. Although the χ 2 statistic was significant (χ 2 = , df= 986, p< 0.001), the normed χ 2 statistic met an acceptable cutoff (χ 2 /df= 2.062). Also, the RMSEA was acceptable (0.069), ranged 94
107 between a 0.3 and 0.8 value. As the CFI and TLI approach 1.0, the model is suggested as a better fit. In this sense, the CFI (0.826) and TLI (0.810) values indicated fairly good fit. For construct reliability, Cronbach s α and the composite reliability were estimated. The Cronbach s α ranged between (hedonism) and (universalism), and the composite reliability ranged between (hedonism) and (benevolence). Since these values surpassed 0.6 Cronbach s α and 0.7 of composite reliability, the reliability was supported. Furthermore, convergent validity was supported based on 0.5 or higher standardized factor loadings, and proximate to or exceed AVE values of acceptable threshold. Table 20. Confirmatory Factor Analysis of Schwartz Values a Standardized estimate Standard error t-value Universalism (Cronbach s α=.878, CR b =.911, AVE c =.441) X 1 : Wisdom X 2 : Social justice * X 3 : A world at peace * X 4 : Unity with nature * X 5 : Equality * X 6 : A world of beauty * X 7 : Inner harmony * X 8 : Protecting the environment * X 9 : Broad-minded * Benevolence (Cronbach s α=.877, CR=.937, AVE=.505) X 10 : Helpful X 11 : Honest * X 12 : Loyal * X 13 : Responsible * X 14 : Forgiving * X 15 : Meaning in life * X 16: Mature love * X 17 : True friendship * 95
108 Tradition (Cronbach s α=.759, CR=.799, AVE=.391) X 18 : Humble X 19 : Respect for tradition * X 20 : Accepting my portion in life * X 21 : Moderate * X 22 : Devout * Conformity (Cronbach s α=.769, CR=.856, AVE=.524) X 23 : Self-discipline X 24 : Honoring of parents and elders * X 25 : Politeness * Security (Cronbach s α=.728, CR=.818, AVE=.392) X 26 : Clean X 27 : Family security * X 28 : Healthy * X 29 : National security * Power (Cronbach s α=.843, CR=.809, AVE=.541) X 30 : Social power X 31 : Authority * X 32 : Social recognition * X 33 : Wealth * Achievement (Cronbach s α=.795, CR=.803, AVE=.565) X 34 : Successful X 35 : Ambitious * X 36 : Influential * Hedonism (Cronbach s α=.720, CR=.762, AVE=.571) X 37 : Enjoying life X 38 : Pleasure * Stimulation (Cronbach s α=737, CR=.765, AVE=.490) X 39 : An exciting life X 40 : Daring * X 41 : A varied life * Self-direction (Cronbach s α=.826, CR=.898, AVE=.457) X 42 : Independent X 43 : Freedom * X 44 : Choosing own goals * X 45 : Self-respect * X 46 : Creativity * X 47 : Curious * Model fit. χ 2 = (df= 986, p<.001), χ 2 /df= 2.062; CFI=.826, TLI=.810, RMSEA=.069 Note. a Nine items (social order, reciprocation of favors, detachment, preserving my public image, obedient, intelligent, capable, a spiritual life, and sense of belonging) were deleted. b Composite reliability, c Average variance extracted, * p<
109 Perceived Customer Value Perceived customer value toward the slow fashion product was measured by Sweeney and Soutar s (2001) PERVAL scale comprised of four dimensions that included emotional, quality, price, and social values. Initial CFA with the four-factor model revealed that two reversed items (i.e., has poor workmanship. and would not last a long time. ) and one item ( is reasonably price. ) had significant amounts of modification indices across multiple items. Thus, deleting the items, the CFA was repeated with a total number of 16 items of the four dimensions (Table 21). Overall, the model fit was satisfactory. Despite the significant χ 2 statistic (χ 2 = , df= 98, p< 0.001), the normed χ 2 statistic (χ 2 /df= 2.992), the CFI (0.937) and the TLI (0.923) met the threshold. Although the RMSEA was 0.095, which was regarded as mediocre fit (MacCallum et al., 1996), absolute fit indices were deemed to be acceptable given the satisfactory normed χ 2 statistic. Based on Cronbach s α values, ranging from (Price) to (Emotional), and construct reliability values between (Price) and (Emotional), the scale was judged to be highly reliable. Furthermore, convergent validity of the scale was supported, given a 0.5 or higher standardized factor loadings and the AVE values. 97
110 Table 21. Confirmatory Factor Analysis of Perceived Customer Values toward Slow Fashion Products a Standardized estimate Standard error t-value Compared to fast fashion, you perceive that a slow fashion product. Emotional (Cronbach s α=.927, CR b =.948, AVE c =.720) X 1 : Is one that I would feel relaxed about using X 2 : Would make me want to use it * X 3 : Is one that I would enjoy * X 4 : Would make me feel good * X 5 : Would give me pleasure * Quality (Cronbach s α=.902, CR=.946, AVE=.700) X 6 : Is well made X 7 : Has consistent quality * X 8 : Has an acceptable standard of quality * X 9 : Would perform consistently * Price (Cronbach s α=.849, CR=.886, AVE=.667) X 10 : Offers value for money X 11 : Is a good product for the price * X 12 : Would be economical * Social (Cronbach s α=.926, CR=.937, AVE=.762) X 13 : Would make a good impression on other people X 14 : Would give its owner social approval * X 15 : Would improve the way I am perceived * X 16 : Would help me to feel acceptable * Model fit. χ 2 = (df= 98, p<.001), χ 2 /df= 2.992, CFI=.937, TLI=.923, RMSEA=.095 Note. a Three items ( has poor workmanship., would not last a long time. and is reasonably price. ) were deleted. b Composite reliability, b Average variance extracted, * p<.001 Validating Dimensions of Consumer Orientation to Slow Fashion Validation In order to identify the slow fashion concept, the measurement and dimensions of consumer orientation to slow fashion were identified in the preliminary study through the 98
111 scale item generation and scale item purification processes. In line with Churchill s (1979) paradigm, this part validated the purified scale with the main survey data (N= 221). The CFA was performed to find validity of the five-dimension model of 15 items (Table 22). By the maximum likelihood estimation, AMOS 21.0 analyzed the data. In this model, the χ 2 statistic was significant (χ 2 = , df= 80, p< 0.001), rejecting the exactfit hypothesis. However, due to sensitiveness of χ 2 by sample size, other model fit indices were further considered such as the normed χ 2 (χ 2 /df= 2.475), the CFI (0.914), the TLI (0.887), and the RMSEA (0.082). These indices indicated that the model fit the data fairly well by satisfying acceptable thresholds. In order to examine reliability of each dimension, Cronbach s α and composite reliability values were estimated (Table 22). Cronbach s α values ranged from (Functionality) to (Equity), and composite reliability values ranged from (Authenticity) to (Equity). All constructs were found to be reliable by holding above 0.6 of Cronbach s α and above 0.7 of the composite reliability (Bagozzi, Yi, & Phillips, 1991; Hair et al., 2009). For convergent validity, this study considered standardized factor loadings and average variance extracted (AVE) values. As shown in Table 22, all standardized factor loadings and AVEs were significant and higher than the acceptable threshold of 0.5, except for the AVE values of Authenticity (0.404) and Functionality (0.394). However, the model statistics provide preliminary evidence, and acceptable thresholds should not be over-generalized as golden rules as cutoff points (Kline, 2011). Following this, overall convergent validity of the constructs in the slow fashion orientation scale was 99
112 deemed to be acceptable. Table 22. Confirmatory Factor Analysis of Consumer Orientation to Slow Fashion: A Nationwide Sample (N=221) Standardized estimate Standard error t-value Equity (Cronbach s α=.876, CR a =.871, AVE b =.701) X 1 : Fair compensation for apparel producers is important to me when I buy clothes. X 2 : I am concerned about fair trade when I buy clothes * X 3 : I am concerned about the working conditions of producers when I buy clothes * Authenticity (Cronbach s α=.656, CR=.746, AVE=.404) X 4 : I value clothes made by traditional techniques X 5 : Craftsmanship is very important in clothes * X 6 : Handcrafted clothes are more valuable than massproduced ones * Functionality (Cronbach s α=.651, CR=.752, AVE=.394) X 7 : I tend to keep clothes as long as possible rather than discarding quickly. X 8 : I often enjoy wearing the same clothes in multiple * ways. X 9 : I prefer simple and class designs * Localism (Cronbach s α=.740, CR=.798, AVE=.496) X 10 : I prefer buying clothes made in U.S. to clothes manufactured overseas. X 11 : I believe clothes made of locally produced * materials are more valuable. X 12 : We need to support U.S. apparel brands * Exclusivity (Cronbach s α=.836, CR=.823, AVE=.642) X 13 : Limited editions hold special appeal for me X 14 : I am very attracted to rare apparel items * X 15 : I enjoy having clothes that others do not * Model fit. χ 2 = (df=80, p<.000), χ 2 /df= 2.475; CFI=.914, TLI=.887, RMSEA=.082 Note. a Composite reliability, b Average variance extracted, * p<
113 Discriminant validity of the scale was evaluated by the AVE estimates and the correlation matrix. To support discriminant validity, the square root of the AVE values of any two constructs should be greater than the correlation estimate between these two constructs (Fornell & Larcker, 1981). As shown in Table 23, in all cases, the square root of the AVE of each dimension was greater than the corresponding correlation estimate, indicating the discriminant validity. In conclusion, the 15-item scale of five dimensions that explained the slow fashion orientation was reliable and valid across different targeted samples; thus, the five dimensions, Equity, Authenticity, Functionality, Localism and Exclusivity, manifested the slow fashion concept. Table 23. Mean, Standard Deviation, and Correlations of Consumer Orientation to Slow Fashion: A Nationwide Sample (N=221) Mean SD Correlations 1.Equity Authenticity * Functionality *.419* Localism *.604*.359* Exclusivity *.424* *.801 Note. The lower triangle of the matrix represents the correlation coefficients between constructs. The diagonal values in bold represent the square root of the average variance extracted of each construct. * p<
114 Relationships among Slow Fashion, Environmental Sustainability and Social Sustainability As explained in Chapter II, the concept of slow fashion may be conceptually associated with environmental aspect of sustainability and social aspect of sustainability. Thus, this part attempted to examine relationships among the three concepts, thereby, further supporting discriminate validity of the consumer orientation to slow fashion. The relationships were examined through the correlations matrix (Table 24). Not surprisingly, the Equity dimension of slow fashion had fairly high correlation with socially sustainable consumption (r= 0.748, p< 0.001). This occurred because the dimension involved concerns about fair trade, fair compensation and a good working environment for workers. The correlation between the Equity dimension and environmental apparel consumption was also moderately high (r= 0.689, p< 0.001). This implied that people who concerned about social sustainability of consumption are also likely to consider the environmental impact of consumption. Other dimensions of slow fashion were moderately correlated to environmental apparel consumption and socially responsible consumption, ranging from to of correlation coefficients. Especially, given that the Functionality or Exclusivity dimensions revealed relatively low correlation coefficients with environmental apparel consumption and socially responsible consumption, these dimensions may account for distinctive features of slow fashion. From these results, it was possible to conclude that the slow fashion concept is associated with sustainability, but it also captures unique notions that the environmental apparel 102
115 consumption and socially responsible consumption do not. Therefore, discriminant validity of the developed measurement of the consumer orientation to the slow fashion concept was supported. Table 24. Correlations between Slow Fashion and Existing Sustainability Slow fashion orientation Environmental apparel consumption Socially responsible consumption Equity.689*.748* Authenticity.506*.598* Functionality.236*.353* Localism.443*.619* Exclusivity.415*.323* Note. * p<.001 Study I. Profiling Potential Slow Fashion Consumers Group Identification A cluster analysis was used to identify consumer groups based on respondents slow fashion orientation. Following Punj and Stewart s (1983) a two-stage procedure, the hierarchical cluster analysis by Ward s method was first conducted to obtain information about a candidate number of clusters, a starting point for each cluster, and the identification of outliers. Then, the nonhierarchical cluster analysis of K-means by the Euclidian distances method was used to refine the clusters. The combination of both hierarchical and nonhierarchical methods is complementary because both compensate for each other (Hair et al., 2009). The hierarchical cluster analysis found that there were no outliers. Also, the examination of the dendrogram showed that a four-cluster solution is the most meaningful (Appendix G). For the purpose of refining the clusters, a non-hierarchical 103
116 cluster analysis was conducted with the four clusters. As summarized in Table 25, the analysis of variance (ANOVA) confirmed significant differences among identified groups, and Tukey s post hoc showed detailed information of the group differences. Also, homoscedasticity was examined through the homogeneity of the variance test, and the equal variance of dependent variables across independent variables was assumed. Group 1 accounted for the largest portion of the respondents, and was named the high involvement in slow fashion group (n= 78, 35.29%). This group showed the highest mean scores across all five slow fashion dimensions, suggesting that this group was highly oriented to slow fashion. Group 2 was labeled the traditional group (n= 64, 28.96%), since this group showed high extents of the Equity, Authenticity, Functionality and Localism dimensions. Particularly, this group had the highest mean score on the Functionality dimension which involved purchasing a simple style and wearing it longer, for several fashion seasons, in multiple ways. Group 3 was named the exclusivity oriented group (n= 51, 23.08%). Compared to other groups, this group tended to reveal a relatively high mean score in the Exclusivity dimension, while other dimensions showed lower mean scores than total mean scores. Group 4 was referred to as the low involvement in slow fashion group (n= 28, 12.67%), because this group had the lowest mean scores on all four dimensions of slow fashion. That is, the subjects who belonged to this group were the least likely to be interested in slow fashion. 104
117 Table 25. Group Classifications by the Dimensions of Slow Fashion Orientation Total Group 1 High involvement (N=221, (n=78, 100 %) %) Group 2 Traditional Group 3 Exclusivity oriented (n=51, %) Group 4 Low involvement (n=28, %) F value (n=64, %) Equity A 3.547B 2.843C 2.083D * Authenticity A 3.833B 3.706B 2.964C * Functionality A 4.302A 3.843B 3.631B * Localism A 4.125B 3.732C 2.976D * Exclusivity A 2.385C 3.621B 2.369C * Note. ABCD denotes group differences by post hoc analysis (Tukey). * p<.001 Predictive Validity of the Identified Groups as Potential Slow Fashion Consumers Before profiling each consumer segment, this study attempted to confirm that the clustered consumer groups can predict potential slow fashion consumers; thus, this study examined the level of purchase intention, intention to pay a price premium for slow fashion products, and the perceived acceptable level of the price premium according to each group through the ANOVA test. Table 26 showed that the high involvement in slow fashion group (Group 1) had the highest willingness to purchase slow fashion products and to pay a price premium to buy slow fashion, compared to other groups. Also, this group was willing to pay 30-40% more to buy slow fashion products than to buy fast fashion products. This amount was a significantly high range compared to other groups. Hence, this study regarded that the individuals in the high involvement in slow fashion group (Group 1) are more likely to be slow fashion consumers in the future. By contrast, the low involvement in slow fashion group (Group 4) revealed the lowest level of purchase intention, price premium intention, and the amount of price premium for slow fashion products, implying that the individuals 105
118 in this group are less likely to become potential slow fashion consumers. The traditional group (Group 2) and the exclusivity oriented group (Group 3) indicated an intermediate level of willingness to buy slow fashion products and pay more money among the groups. However, with regard to the amount of price premium, the traditional group (Group 2) and the exclusivity oriented group (Group 3) did not statistically differ from the low involvement in slow fashion group (Group 4) by showing approximately 20% of price premium of slow fashion products, compared to fast fashion products. Therefore, the four groups seemed to be plausible consumer segments which can be found in the general population, in that the level of purchase intention, willingness to pay a price premium, and acceptable price premium for slow fashion products are different across the groups. Table 26. Predictive Validity of Groups Total Group 1 High involvement Group 2 Traditional Group 3 Exclusivity oriented Group 4 Low involvement F value Purchase A 3.734B 3.719B 3.214C * intention Price premium A 3.287B 3.438B 2.762C * intention Acceptable A 2.219B 2.569B 2.321B * price premium a Note. ABC denotes group differences by post hoc analysis (Tukey). a The acceptable amount of price premium was evaluated with a 9-point interval scale (0=same as fast fashion products, 1=10% more, 2=20% more, 3=30% more, 4=40% more, 5=50% more [1.5 times as much], 6=75% more, 7=100% more [twice as much], 8=more than twice as much) * p<.001 Comparison of Groups on Personal Values This section examined group differences in terms of personal value. As found in the preliminary analyses, ten types of Schwartz values were used as consumers personal 106
119 value disposition. The ten types of values form a continuum, and they structure two bipolar dimensions (Schwartz & Bilsky, 1987; Schwartz, 1994). As mentioned in the literature review, the first bipolar dimension is the Self-transcendence and Selfenhancement. The Self-transcendence dimension includes universalism and benevolence value types, whereas the Self-enhancement dimension consists of power, achievement and hedonism value types. The second bipolar dimension is Conservation and Openness to change. The Conservation dimension consists of tradition, conformity and security value types, while the Openness to change value types are comprised of hedonism, stimulation and self-direction value types. Calculating the mean of each value type, this study profiled respondents personal values by groups. As presented in Table 27, the ANOVA and Tukey s post hot test revealed that there were significant group differences in each value type, except for hedonism (F= 2.072, p> 0.05). Specifically, the high involvement in slow fashion group (Group 1) had the highest mean scores on all types of Schwartz values, meaning that the two bipolar structures of the Schwartz values (Self-transcendence vs. Self-enhancement, and Conservation vs. Openness to change) coexist in this group. That is, this group was disposed to concern for others (i.e., universalism and benevolence), while pursuing personal interest as well (i.e., power and achievement). Also, this group was likely to be simultaneously guided by conservative values (i.e., tradition, conformity and security) and progressive values (i.e., stimulation and self-direction). In the traditional group (Group 2), the Self-transcendence dimension, such as universalism and benevolence value types, and the Conservation dimension, including tradition, conformity, and 107
120 security value types, were shown to be significantly higher than in the exclusivity oriented group (Group 3) and the low involvement in slow fashion group (Group 4). This result manifested that the traditional group (Group 2) tends to be caring toward others (i.e., universalism and benevolence), and they may prefer following existing patterns in their life (i.e., tradition, conformity and security), rather than adopting new ones. In contrast to the traditional group (Group 2), the exclusivity oriented group (Group 3) showed the higher levels of the power and stimulation value; thus, this consumer group was more likely to pursue social status and prestige (i.e., power), as well as novelty and excitement in life (i.e., stimulation). The low involvement in slow fashion group (Group 4) had the lowest mean scores across all value types. In conclusion, the results revealed consistent patterns of the distinctive value dispositions that each group has. Especially, the slow fashion oriented consumers tended to possess more complicated value types than the other groups by simultaneously revealing coexistence of contrasting values. 108
121 109 Table 27. Group Profiles by Personal Values (Schwartz Values) Schwartz Value Dimensions Schwartz value types Total Group 1 High involvement Group 2 Traditional Group 3 Exclusivity oriented Group 4 Low involvement F value Selftranscendence Universalism A 4.097B 3.852BC 3.679C ** Benevolence A 4.392A 4.113B 3.968B 9.091** Conservation Tradition A 3.906AB 3.694B 3.643B 7.713** Conformity A 4.406AB 4.118BC 3.952C 7.124** Security A 4.338AB 4.106B 4.086B 5.995* Self-enhancement Power A 2.953B 3.098B 2.786B ** Achievement A 3.438B 3.418B 3.333B ** Openness to Hedonism a A 4.148A 4.108A 4.089A change Stimulation A 3.188B 3.346B 3.155B ** Self-direction A 4.180B 4.069B 3.982B 9.049** Note. ABC denotes group differences by post hoc analysis (Tukey). a Hedonism value type belongs to both Self-enhancement and Openness to change dimensions (Schwartz, 1992). * p<.01 ** p<.001
122 Comparison of Groups on Apparel Consumption Behaviors In order to further investigate group differences in apparel consumption behaviors, the ANOVA and Tukey s post hoc test were undertaken. Specifically, apparel consumption behaviors were assessed by apparel acquisition, share of purchases with fast fashion, and disposal behaviors. In Table 28, significant differences were found in the number of clothing purchases (F= , p< 0.001), money spent for monthly clothing purchases (F= , p< 0.001), share of number of fast fashion purchases (F= , p< 0.001), and share of money spent with fast fashion (F= , p< 0.001) across groups. Among the four groups, the high involvement in slow fashion group (Group 1) showed the highest number of clothing purchases (approximately 2-3) and money spent for monthly clothing purchases (approximately $51-100). This group was also the highest in buying and spending money for fast fashion (approximately 25% of total apparel purchases). The highest amount of apparel purchases of this group indicated that slow fashion consumers are fashion-savvy. Especially, given that the high involvement in slow fashion group (Group 1) was the most likely to purchase and pay more money for the slow fashion products, the highest amount of fast fashion purchases of this group implies that slow fashion and fast fashion may not have dichotomous consumption. The exclusivity oriented group (Group 3) followed the high involvement in slow fashion group (Group 1) in terms of number of purchase and money spent for fast fashion (approximately 20% of total apparel purchases). In contrast, the traditional group (Group 2) was the least likely to depend on fast fashion (approximately 5% of total apparel purchases) among the four 110
123 groups. This finding was consistent with the fact that the traditional consumer group (Group 2) showed the highest level of the Functionality dimension of slow fashion among the four groups. In turn, this group was oriented toward a longer product lifespan in the apparel consumption, which may not less fit fast fashion products. With regard to apparel disposal behavior, the results revealed significant differences among four groups in all disposal behaviors, except for have the item mended (F= 2.775, p> 0.05) and discard the item (F= 0.571, p> 0.05). Especially, notable differences were found between the high involvement in slow fashion group (Group 1) and the low involvement in slow fashion group (Group 4). That is, compared to the low involvement group (Group 4), the high involvement group (Group 1) was more engaging in recycling disposal options, such as handing down, donation, swapping and reselling. 111
124 112 Table 28. Group Profiles by Apparel Consumption Behaviors Total Group 1 High involvement Group 2 Traditional Group 3 Exclusivity oriented Group 4 Low involvement F value Apparel acquisition behavior Monthly number of purchase A 1.547B 2.000A 1.429B ** Monthly money spent A 1.953BC 2.490AB 1.857C ** Share of purchase with fast fashion a Share of number of purchase A 5.750C AB 9.500BC ** Share of money spent A 5.672C AB 8.107BC ** Apparel disposal behavior Have the item mended A 2.719A 2.510A 2.500A Hand the item down A 3.016A 3.137A 2.393B 6.061* Store the item regardless of usage A 2.469B 2.765AB 2.679AB 6.525** Donate the item A 3.719A 3.510A 2.821B 8.603** Swap the item A 1.734B 1.804B 1.607B 7.258** Resell the item A 1.734AB 2.078A 1.464B 4.647** Discard the item A 2.469A 2.686A 2.643A.571 Note. ABC denotes group differences by post hoc analysis (Tukey). a The two items for share of purchase with fast fashion were measured by a ratio scale (0-100%). * p<.01 ** p<.001
125 Comparison of Groups on Demographic Variables To profile the groups by demographic information, this study compared respondents age, the highest education level, and individual income level among the four groups with the ANOVA. In addition, gender and marital status among the groups were compared by crosstabs. The ethnicity variable was not used in this section because the majority of the subjects of this study were Caucasian/ Anglo/ European American (74.21%). First, the ANOVA test revealed that the average age of the traditional consumer group (Group 3) was found to be significantly higher than the other three groups (F= , p< 0.001). However, no significant difference was found among the groups in education and income levels (Table 29). Second, the χ 2 statistics showed that the difference found in the gender variable was significant (χ 2 = 8.414, df= 3, p< 0.05), but not in marital status (χ 2 = 3.069, df= 3, p> 0.05) (Table 30). In other words, the high involvement in slow fashion group (Group 1) and the exclusivity oriented group (Group 3) comprised of a balanced ratio between male and female. However, the traditional group (Group 2) comprised of a higher percentage of female (62.50%) than the percentage of male (37.50%). By contrast, a higher percentage of male (67.86%) than female (32.14%) belonged to the low involvement in slow fashion group (Group 4). 113
126 Table 29. Group Profiles by Age, Education and Individual Income Level Total Group 1 High involvement Group 2 Traditional Group 3 Exclusivity oriented Group 4 Low involvement F value Age B A B B * Education Income Note. AB denotes group differences by post hoc analysis (Tukey). * p<.001 Table 30. Group Profiles by Gender and Marital Status Gender χ 2 = (df= 3, p<.05) Group 1 High involvement Group 2 Traditional Group 3 Exclusivity oriented Group 4 Low involvement Total Male 42(53.85%) a 24(37.50%) 28(54.90%) 19(67.86%) 113 Female 36(46.15%) 40(62.50%) 23(45.10%) 9 (32.14%) 108 Marital status χ 2 = (df= 3, p>.05) Married 37(47.44%) 39(60.94%) 26(50.98%) 13(46.43%) 115 Unmarried 41(52.56%) 25(39.06%) 25(49.02%) 15(53.57%) 106 Total 78 (100%) 64 (100%) 51 (100%) 28 (100%) 221 Note. a The percentage in parenthesis is based on column. Study II. Structural Equation Modeling to Test Hypothetical Relationships Structural equation modeling (SEM) was employed to test hypotheses built by the customer value creation framework. Following Anderson and Gerbing s (1988) two-step approach, the measurement model fit was first assessed. After confirming an adequate fit of the measurement model, the structural model was tested. Measurement Model Analysis The measurement model of the SEM analysis consists of eight constructs: five dimension of slow fashion orientation with each dimension accounting for one construct (Equity, Authenticity, Functionality, Localism, and Exclusivity), perceived customer 114
127 value, purchase intention and willingness to pay a price premium. Since the perceived customer value construct contained emotional, quality, price and social value dimensions, mean scores of each dimension were used as indicators for the parsimonious model; thus, the measurement model comprised of eight constructs measured by 25 observed variables (Figure 8). Figure 8. A Visual Diagram of the Measurement Model Note. Error terms are omitted in this diagram. Table 31 summarizes the result of the measurement model CFA. The χ 2 statistic was (df= 247, p< 0.001), but based on the normed χ 2 (χ 2 /df= 2.168), the CFI (0.909), the TLI (0.889), and the RMSEA (0.073), the overall model fit was deemed to be acceptable. Cronbach s α values ranged from 0.651(Functionality) to (Perceived customer value) and the composite reliability ranged from (Authenticity) to (Perceived customer value); therefore, the reliability of the measurement model was supported. For the construct validity, this study considered convergent validity and discriminant validity. First, convergent validity was verified through standardized factor 115
128 loadings and AVE values. As seen in Table 31, all standardized factor loadings were very close to or higher than 0.5. The AVE values were ranged from 0.391(Functionality) to (Purchase intention). While AVEs for Functionality and Authenticity constructs did not meet the threshold of 0.5, considering adequate standardized factor loadings and AVE values of all other variables, this study regarded that overall convergent validity was supported. Second, discriminant validity of the scale was evaluated by AVE estimates and the correlation matrix (Table 32). As suggested by Fornell and Larcker (1981), this study found that the square root of the AVE values of any two constructs were greater than the correlation estimate between these two constructs in all cases, supporting the discriminant validity of the measurement model. In conclusion, the measurement model of this study was confirmed as an adequate model fit with the data, reliability and validity. With the verified measurements, the results of structural model testing seven hypotheses are presented next. 116
129 Table 31. Confirmatory Factor Analysis of the Measurement Model Standardized estimate Standard error t-value Equity (Cronbach s α=.876, CR a =.872, AVE b =.702) X 1 : Fair compensation for apparel producers is important to me when I buy clothes. X 2 : I am concerned about fair trade when I buy clothes * X 3 : I am concerned about the working conditions of producers * when I buy clothes. Authenticity (Cronbach s α=.656, CR=.746, AVE=.404) X 4 : I value clothes made by traditional techniques X 5 : Craftsmanship is very important in clothes * X 6 : Handcrafted clothes are more valuable than mass-produced * ones. Functionality (Cronbach s α=.651, CR=.749, AVE=.391) X 7 : I often enjoy wearing the same clothes in multiple ways X 8 : I tend to keep clothes as long as possible rather than discarding * quickly. X 9 : I prefer simple and class designs * Localism (Cronbach s α=.740, CR=.797, AVE=.495) X 10 : I prefer buying clothes made in U.S. to clothes manufactured overseas. X 11 : I believe clothes made of locally produced materials are more * valuable. X 12 : We need to support U.S. apparel brands * Exclusivity (Cronbach s α=.836, CR=.824, AVE=.642) X 13 : Limited editions hold special appeal for me X 14 : I am very attracted to rare apparel items * X 15 : I enjoy having clothes that others do not * Perceived Customer Value (Cronbach s α=.954, CR=.935, AVE=.682) Y 1 : Emotional Y 2 : Quality * Y 3 : Price * Y 4 : Social * Purchase Intention (Cronbach s α=.890, CR=.919, AVE=.734) Y 5 : There is a strong likelihood that I will buy slow fashion products Y 6 : I will purchase slow fashion products * Y 7 : I would consider buying slow fashion products * Willingness to Pay a Price Premium (Cronbach s α=.827, CR=.838, AVE=.615) Y 8 : Buying slow fashion products seems smart to me even if they cost more Y 9 : I would still buy slow fashion products if other brands reduced * their prices. Y 10 : I am ready to pay a higher price for slow fashion products * Model fit. χ 2 = (df= 247, p<.001), χ 2 /df= 2.168; CFI=.909, TLI=.889, RMSEA=.073 Note. a Composite reliability, b Average variance extracted, * p<
130 118 Table 32. Mean, Standard Deviation, and Correlations of the Measurement Model (N=221) 1. Equity Mean SD Correlations Authenticity ** Functionality **.419** Localism **.604**.359** Exclusivity **.424* ** Perceived Customer Value **.478**.281**.356**.416** Purchase Intention **.395**.271**.327**.397**.696** Willingness to Pay a Price Premium **.414**.191*.373**.442**.630**.727**.784 Note. The lower triangle of the matrix represents the correlation coefficients between constructs. The diagonal values in bold represent the square root of the AVE of each construct. * p<.01, ** p<.001
131 Structural Model Analysis The result of a structural model analyzed by the maximum likelihood estimation method revealed a satisfactory goodness-of-fit (GOF). Specifically, the χ 2 statistic was significant (χ 2 = , df= 258, p< 0.001), rejecting the exact-fit hypothesis. However, since the χ 2 statistic is sensitive to sample size (Hair et al., 2009), other model fit indices were further considered, such as the normed χ 2 statistic (χ 2 /df= 2.369), the CFI (0.888), the TLI (0.870), and the RMSEA (0.079). Based on the model fit indices, the model seemed to have a fair GOF. However, the modification indices suggested a direct path from purchase intention construct to willingness to pay a price premium construct (Figure 9). That is, a person who has high intention to buy slow fashion products is more willing to pay a higher price for the products. In order to test the statistical significance of the improvement in overall fit after adding a free parameter (i.e., purchase intention willingness to pay a price premium), the χ 2 difference test was performed (Kline, 2011). The χ 2 statistic of the alternative model (i.e., adding the path of purchase intention to willingness to pay a price premium) was (df= 257, p< 0.001). Compared to the χ 2 statistic of the original model (χ 2 = , df= 258), the χ 2 statistic of the alternative model was statistically better (χ 2 D = , df D = 1) at the 0.05 level (χ 2 crit = 3.84, df= 1). Therefore, this study adopted the alternative model that included a path from purchase intention to willingness to pay a price premium to further test hypotheses. 119
132 Figure 9. The Original Model (a) and the Alternative Model (b) (a) The Original Model Note. χ 2 = , df= 258, p<.001 (b) The Alternative Model Note. χ 2 = , df= 257, p<.001 The bold arrow represents the added path suggested by the modification indices. 120
133 The CFA estimated the GOF of the alternative model. In spite of the significant χ 2, the normed χ 2 statistic was 2.209, which was an acceptable magnitude. Also, the CFI was 0.901, the TLI was and the RMSEA was 0.074, indicating the satisfactory model fit. Figure 10 illustrates the results of the hypotheses test in the alternative structural model. H1 posited that a person who is concerned with the Equity dimension (i.e., working environment in the factory and fair compensation for workers) would positively affect the perceived customer value to slow fashion products. However, it was found that the Equity orientation did not contribute to the respondents perceived value toward slow fashion products (γ 11 = 0.157, t=1.273, p >.05), rejecting H1 In testing H2, consumers preference for hand craftsmanship and traditional garment construction methods (i.e., Authenticity) also did not increase the consumers perceived customer value on slow fashion products (γ 12 = 0.289, t= 0.716, p>.05). Therefore, H2 was not supported. H3 deemed that consumers who care for the Functionality of clothing (e.g., enjoy wearing the same clothes in multiple ways, keeping clothes as long as possible rather than discarding quickly, etc.) would value slow fashion. However, the result showed that the Functionality orientation was not related to customer value perception (γ 13 = 0.249, t= 1.474, p>.05); thus, H3 was not supported. H4 was also rejected, which posited the relationship between individual s Localism orientation of the apparel consumption and the perceived customer value to slow fashion (γ 14 = , t= , p>.05). H5, which proposed that the consumers orientation that pursue Exclusivity in the apparel consumption lead to perceived customer value toward slow fashion products, was 121
134 supported (γ 15 = 0.284, t= 2.035, p<.05). This indicates that consumers who are seeking unique and limited edition clothing are likely to perceive values in slow fashion products. With regard to the relationships between customer value and marketing outcomes, H6 and H7 supported the customer value creation framework. In other words, H6 proposed that the perceived customer value would increase purchase intention. Supporting H6, this study found that customer value perception toward slow fashion products significantly lead to intention to buy slow fashion products (β 21 = 0.785, t= , p<.001). The test result of H7 showed that as the consumers perceived more value on slow fashion products, they were more likely to be willing to pay a price premium to buy the products (β 31 = 0.190, t= 2.059, p<.05); thus, H7 was supported. Additionally, the path suggested by the modification indices was significant (β 32 = 0.705, t= 7.112, p<.001). This indicated that that consumer s purchase intention for slow fashion increases his or her willingness to pay more to buy slow fashion products. 122
135 123 Figure 10. Structural Equation Modeling for Testing Hypotheses Model fit. χ 2 = (df= 257, p<.001), χ 2 /df= 2.209, CFI=.901, TLI=.884, RMSEA=.074 Squared multiple correlations (R 2 ): η 1 =.433, η 2 =.616, η 3 =.745 Note. Φ, λ x, λ y, δ, ε were omitted in this figure. * p<.05, ** p<.001 Coefficients: standardized solution Dotted line represents an insignificant path. Black line represents a significant path.
136 Summary This chapter provided information about the sample of this study and results of the data analyses. As preliminary analyses, data normality and outliers were inspected, and the CFA was conducted on each major construct. Then, the dimensions of consumer orientation to slow fashion were validated with the main survey data. Also, the relationships between slow fashion and existing sustainability were examined. As the main data was analyzed, Study I identified four consumer segments, and the groups were profiled by their personal values, apparel consumption behaviors, and demographic characteristics. In Study II, the hypotheses developed by the customer value creation were tested. The next chapter will further discuss the findings. Based on the findings, this study will provide contributions, limitations, and suggestions for future studies. 124
137 CHAPTER V CONCLUSIONS Based on the results in Chapter IV, this chapter discusses the findings in detail. This chapter is organized as follows: (1) Summary of Findings, (2) Discussion of Major Findings, (3) Implications, and (4) Limitations and Suggestions for Future Research. Summary of Findings This dissertation consisted of a preliminary study and two major studies. In the preliminary study, the dimensions of consumer orientation to slow fashion were found as Equity, Authenticity, Functionality, Localism and Exclusivity. In Study I, based on the dimensions of consumer orientation to slow fashion, four consumer groups were identified by cluster analysis, namely, the high involvement in slow fashion group, the traditional group, the exclusivity oriented group, and the low involvement in slow fashion group. The four groups were profiled by their personal value, apparel consumption behaviors and demographic variables. Study II hypothesized that each dimension of consumer orientation to slow fashion affected perceived customer value on slow fashion products, which in turn increased purchase intention and willingness to pay a price premium. Findings showed that among five dimensions of consumer orientation to slow fashion, only Exclusivity consumer orientation enhanced the perceived customer value of slow fashion products, and the perceived value led to purchase intention and willingness to pay a price premium toward slow fashion products. Further details are discussed next. 125
138 Discussion of Major Findings The discussion of findings is organized by answers to the three research questions raised in Chapter I: (1) What is slow fashion? (2) Who will potential slow fashion consumers be? and (3) How do slow fashion brands encourage consumers to buy and pay more for slow fashion products?. What Is Slow Fashion? To elucidate the slow fashion concept in theoretical perspectives, the scale item generation, purification and validation procedures were conducted with several surveys based on Churchill s (1979) paradigm. In the preliminary study, the scale item generation and purification stages were conducted by an open-ended question and two surveys with both a student sample and a non-student sample. Through the main survey, the scale validation procedure was undertaken. As a result, a total number of 15 items measuring consumer orientation to slow fashion were developed, which clearly revealed five underlying dimensions of slow fashion: Equity, Authenticity, Functionality, Localism and Exclusivity. First, the Equity dimension emphasized an ethical apparel production of slow fashion (Fletcher, 2008). The slow production system guarantees regular working hours and lessens excessive workloads, meaning that workers can produce products in better conditions. Also, workers should be compensated accordingly, and slow fashion products should be equally accessible to everyone through fair trade. Second, the Authenticity dimension was related to the more elaborated products of slow fashion by hand craftsmanship and traditional construction techniques. That is, 126
139 slow production makes fewer garments but a higher quality. Because workers can spend longer on each part of a garment in a slow production system, the slow production by manual labor and original machines also allows richer interaction between makers and products, connoting a story on the items. Third, the Functionality dimension was associated with wearing a piece of clothing longer, more often, and in multiple ways; thus, the Functionality dimension represented slow consumption. To achieve slow consumption, up-to-date fashion trends can be replaced by classic and simple designs that consumers can wear for one or more fashion seasons. Also, simple designs allow people to coordinate in multiple ways. Fourth, the Localism dimension demonstrated locally produced slow fashion products by capitalizing on local resources such as skilled artisans, local factories, or locally produced raw materials. Importantly, the Localism dimension found in this study expanded the idea to a preference for domestic brands over global apparel brands. Fifth, the Exclusivity dimension reflected the scarcity value of slow fashion products. Since slow fashion is based on small quantity production, a small number of products can be exclusively available. In addition, slow fashion products are not as consistent as the commodities manufactured from machines. Slow fashion items do not look precisely identical, even in the same batch. Therefore, slow fashion delivers uniqueness and differentiation of the products. The above identified five underlying dimensions illustrate that the slow fashion concept encompasses concerns about workers, craftsmanship, longevity and versatility of clothing, local orientation, and exclusively available products. The identified five 127
140 dimensions clearly showed the relationship with the environmental sustainability and social sustainability. From the Functionality dimension, this study can explain that slow fashion may strive for a more environmentally sustainable pattern of the apparel consumption by reducing resource consumption and the amount of waste. The Equity dimension is directly related to social sustainability to enhance welfare for people and community. Moreover, given that slow fashion contributes to supporting local businesses and communities, the Localism dimension also improves social sustainability. Furthermore, the slow fashion orientation was compared with environmental apparel consumption and socially responsible consumption by correlation analysis. The Equity dimension was fairly correlated with environmental apparel consumption and socially responsible consumption, while other dimensions showed low to moderate correlations. These findings reveal that the Equity aspect of slow fashion is related to environmental apparel consumption and socially responsible consumption to a certain extent, yet the notion of slow fashion is distinctive and comprehensive enough to discriminate from the existing sustainability concepts. Unique to slow fashion includes aspects of craftsmanship and scarcity value of the products which are clearly manifested in the dimensions of Authenticity and Exclusivity. Who Will Potential Slow Fashion Consumers Be? To solve this research question, Study I aimed to identify potential slow fashion consumer segments and understand their characteristics. With cluster analyses based on consumer orientation to slow fashion, four consumer groups were identified: (1) High involvement in slow fashion group, (2) Traditional group, (3) Exclusivity oriented group, 128
141 and (4) Low involvement in slow fashion group. The four consumer groups were deemed to be meaningful based on the predictive validity test of the groups, which showed different levels of purchase intention and willingness to pay a price premium for slow fashion products across the groups. An acceptable amount of price premium was also found to vary across the groups. The high involvement in slow fashion group (Group 1) accounted for approximately 35% of total subjects which was the largest portion among the four groups. Also, this group showed the highest level of purchase intention and willingness to pay a price premium, and the amount of price premium was the highest. In addition, the traditional group (Group 2) and the exclusivity oriented group (Group 3) accounted for 29% and 23% of total subjects, respectively. They revealed intermediate levels of purchase intention and price premium intention. The low involvement in slow fashion group (Group 4) formed 13% of total subjects, and this group had the lowest level of purchase intention and willingness to pay a price premium for slow fashion products. With the four consumer segments, personal value, apparel consumption behaviors, and demographics of each group were profiled. This study found that each group pertained different personal values and apparel consumption behaviors. However, no significant differences were found in demographics across groups, except that the average age of the traditional group (Group 2) was older than the others. Therefore, focusing on personal value and apparel consumption behavior of each group, this study further explains consumer profiles in the following section. 129
142 Consumer Profiles by Personal Value Each group was profiled by personal value using the Schwartz value types. The high involvement in slow fashion group (Group 1) had the highest mean scores on all types of Schwartz values. This implies that contrasting values coexist. In turn, subjects in this group were more likely to value universalism (e.g., social justice, unity with nature, equality and protecting the environment) and benevolence (e.g., helpful, honest, and responsible) than the other groups. The universalism and benevolence value types belong to the Self-transcendence dimension of the Schwartz value, which are oriented to others. This may be related to the environmental and social sustainability aspects of slow fashion. As found in Chapter IV, the sustainability concept was highly related to the Equity and Localism dimensions amongst the five dimensions of slow fashion. This result is consistent with previous studies which investigated personal value of environmentally friendly consumers (Thøgersen & Ö lander, 2002) and socially conscious consumers (Doran, 2009; Ma & Lee, 2012; Pepper, Jackson, & Uzzell, 2009). Paradoxically, the high involvement in slow fashion group (Group 1) also tended to value power (e.g., social power and social recognition) and achievement (e.g., successful and influential) highly in their life (De Groot & Steg, 2008; Steenhaut & Van Kenhove, 2006). Seeking personal interest and welfare, the value types fall under the Self-enhancement dimension of the Schwartz values. These values may reflect a desire for uniqueness and exclusivity through apparel consumption, and the Exclusivity dimension of slow fashion may satisfy such needs. In sum, the high involvement in slow fashion group (Group 1) may buy slow fashion products for environmental and social 130
143 sustainability as well as for the sake of their interests toward seeking uniqueness and exclusivity. Furthermore, the extent of tradition (e.g., respect for tradition), conformity (e.g., self-discipline) and security values (e.g., family security and national security) were found to be slightly higher in the high involvement in slow fashion group (Group 1) than the rest of the groups. The tradition, conformity and security value types are Conservation dimensions of the Schwartz value, which is less likely to accept change. From this result, we can expect that slow fashion consumers tend to be conservative. They may change their wardrobe less frequently with the idea that buying a classic design and high quality product, and wearing it longer. This practice represents the Functionality dimension of slow fashion. Also, they may prefer clothing made by artisan s manual labor and traditional construction techniques, which was consistent with Authenticity dimension of slow fashion. Given that these conservative values are also associated with the ethical consumerism (Rallapalli, Vitell, Wiebe, & Barnes, 1994; Steenhaut & Van Kenhove, 2006), tradition, conformity, and security values may be consistent with sustainable aspects of slow fashion. At the same time, the high involvement in slow fashion group (Group 1) inclined to stimulation (e.g., an exciting life and a varied life) and self-direction values (e.g., freedom, creativity and curious), which are Openness to change dimension of the Schwartz values. Since these values have been studied as an antecedent of fashion innovation adopting new products or style (Steenkamp et al., 1999; Wang et al., 2008; Workman & Lee, 2011), subjects in the high involvement in slow fashion group (Group 1) 131
144 may strive for novelty and variety through apparel consumption rather than following identical mass trends. Given that the Exclusivity dimension of slow fashion accounted for consumer orientation toward unique and exclusive value of the apparel consumption, stimulation and self-direction value types are related to the Exclusivity dimension. The personal value disposition of the traditional group (Group 2) was highly oriented toward universalism (e.g., social justice, unity with nature, equality and protecting the environment) and benevolence (e.g., helpful, honest, and responsible). Also, this group highly valued tradition (e.g., respect for tradition), conformity (e.g., selfdiscipline) and security (e.g., family security and national security). Compared to the traditional group (Group 2), the exclusivity oriented group (Group 3) highly value power (e.g., social power and social recognition) and stimulation (e.g., an exciting life and a varied life). However, no distinctively strong value tendencies were found in the low involvement in slow fashion group (Group 4). Taking all of these things into account, the results imply that the high involvement in slow fashion group (Group 1) concurrently retains personal value dispositions of the traditional group (Group 2) and the exclusivity oriented group (Group 3). Thus, this study expects that the slow fashion idea can embrace not only consumers who are highly involved in slow fashion, but also traditional consumers and the exclusivity oriented consumers. Consumer Profiles by Apparel Consumption Behaviors For profiling the groups by their apparel consumption behaviors, apparel acquisition (i.e., average number of monthly clothing purchases and average amount of monthly money spent for clothing), share of clothing purchases with fast fashion (i.e., 132
145 share of number of purchases and share of money spent in fast fashion brands), and apparel disposal behaviors (i.e., the level of involvement in each disposal option) were assessed. As a result, the number of monthly clothing purchases and money spent were the largest in the high involvement in slow fashion group (Group 1). Moreover, this group tended to buy the greatest amount of fast fashion clothing, as well as spend the largest amount of money for fast fashion purchases, among the four groups. The high dependency on fast fashion of the high involvement in slow fashion group (Group 1) seemed to be paradoxical, in that the slow fashion philosophy advocates for a shift from quantity to quality (Fletcher, 2007). The response that the high involvement in slow fashion group (Group 1) was likely to buy the largest number of fast fashion products implies that slow fashion and fast fashion are not a dichotomous concept. Instead, as suggested by Fletcher (2007), slow fashion is a different approach in producing and consuming clothing from fast fashion. Also, this finding strongly supports the possibility that the subjects who were classified as Group 1 may be highly involved in fashion. The exclusivity oriented group (Group 3) also revealed high levels of overall apparel purchases as well as fast fashion purchases. This result is plausible since this group was oriented to seek exclusively available apparel products, which implied a high fashion taste and fashion involvement. Therefore, subjects in this group are likely to purchase a number of clothing and spend more money for apparel purchases. By contrast, the traditional group (Group 2) and the low involvement in slow fashion group (Group 4) revealed lower amounts of apparel purchases. Particularly, the traditional group (Group 2) indicated the lowest level of fast fashion purchases out of total apparel purchases 133
146 amongst the four groups. Considering that subjects of this group were highly oriented to Functionality and Authenticity of slow fashion dimensions, and they were disposed to conservative values such as tradition, conformity and security, the results clearly show that the fast fashion ideas, which involves fast production and fast consumption, are inconsistent with the traditional consumer s orientations and values. As mentioned earlier, the traditional group (Group 2) may prefer elaborated clothing that reflects artisan s manual labor or traditional construction methods, rather than mass commodities which are produced by industrial machines. Also, they may be inclined to buying less clothing and wearing it longer without changing their wardrobe frequently. With regard to apparel disposal behavior, in the five options (i.e., hand the item down, store the item regardless of usage, donate the item, swap the item and resell the item), the high involvement in slow fashion group (Group 1) was significantly higher than the low involvement in slow fashion group (Group 4). The traditional group (Group 2) and the exclusivity oriented group (Group 3) revealed intermediate to high engagement in the hand the item down, donate the item, and resell the item options. However, when we take a look at the mean scores of these options, the high involvement in slow fashion group (Group 1), which revealed higher extent than the others, ranged from (Reselling) to (Donation). Given that the disposal options were measured on a 5- Likert scale, these magnitudes indicate rarely or sometimes. In other words, apparel consumers were engaging in the five disposal options at low to mediocre levels. This finding arouses attention to the necessity of promoting clothing recycling, such as hand items down and donation, when clothing is no longer use. 134
147 Thus far, this study has attempted to identify potential slow fashion consumers and understand their characteristics to answer the research question of Who Will Potential Slow Fashion Consumers e?. Given the highest purchase intention, willingness to pay a price premium and acceptable amount of the price premium, the high involvement in slow fashion group (Group 1) may be the most likely to be potential slow fashion consumers. Especially, this group responded that they are willing to pay approximately 30-40% more money to buy slow fashion products, compared to fast fashion items. Together with the highest amount of apparel purchases as well as fast fashion purchases, the high involvement in slow fashion group (Group 1) is likely to be interested in fashion itself, not necessarily in slow fashion. Although the traditional group (Group 2) and the exclusivity oriented group (Group 3) had intermediate purchase intention, willingness to pay a price premium and acceptable amount of the price premium, this study regarded these two groups as potential slow fashion consumers. The reasoning of this is that the two groups involve parts of the consumer orientation to slow fashion, instead of all five dimensions of slow fashion (Equity, Authenticity, Functionality, Localism and Exclusivity) as shown in the high involvement in slow fashion group (Group 1). In other words, each group may be attracted by different attributes of slow fashion; the Authenticity and Functionality aspects of slow fashion may appeal to the traditional group (Group 2), while the exclusivity oriented group (Group 3) may favor the Exclusivity aspect of slow fashion. Another reason is that the two groups shared personal value dispositions that the high involvement in slow fashion group (Group 1) had; the traditional group (Group 2) tended 135
148 toward Self-transcendence and Conservation value dimensions, whereas the exclusivity oriented group (Group 3) was slightly oriented toward Self-enhancement and Openness to change value dimensions. The high involvement in slow fashion group (Group 1) showed strong tendencies toward the four dimensions of the values. Indeed, given that the traditional group (Group 2) and the exclusivity oriented group (Group 3) accounted for over 50% of total subjects, the two groups can serve a significant market for slow fashion products. Table 33 summarizes the consumer profiles found in this study, which can provide information about potential slow fashion consumers. 136
149 Table 33. Consumer Profiles for Slow Fashion Markets Potential marketability Market size Group 1: High involvement Group 2: Traditional Approximately 35% of total subjects Approximately 29% of total subjects Extent of purchase intention Highest Intermediate Extent of price premium intention Highest Intermediate Acceptable price premium Approximately 30-40% more Approximately 20-25% more compared to fast fashion products Personal value disposition Strong coexistence of -Self-transcendence and Selfenhancement values -Conservation and Openness to change values Moderately strong tendency toward -Self-transcendence values -Conservation values Apparel consumption behaviors Average number of monthly apparel purchases Average money spent for monthly apparel purchases Average percentage of apparel purchases made in the fast fashion brands Approximately 2-3 Approximately 1-2 Approximately $ Approximately $21-50 Approximately 25% of total apparel purchases Approximately 5% of total apparel purchases Apparel disposal options Hand it down, store it, donate it Hand it down, donate it Demographics a Average age:41 years old Average age: 54 years old Group 3: Exclusivity Group 4: Low involvement oriented Potential marketability Market size Approximately 23% of total subjects Approximately 13% of total subjects Extent of purchase intention Intermediate Lowest Extent of price premium intention Intermediate Lowest Acceptable price premium compared to fast fashion products Approximately 20-25% more Approximately 20-25% more Personal value disposition Apparel consumption behaviors Average number of monthly apparel purchases Average money spent for monthly apparel purchases Average percentage of apparel purchases made in the fast fashion brands Slight tendency toward -Self-enhancement values -Openness to change values Low tendency toward -Self-transcendence values -Conservation values Approximately 2-3 Approximately 1-2 Approximately $50 Approximately $20 Approximately 20% of total apparel purchases Approximately 8-9% of total apparel purchases Apparel disposal options Hand it down, donate it No distinctiveness was found. Demographics a Average age: 41 years old Average age: 45 years old Note. a No significant group differences were found in demographics (i.e., age, gender, marital status, income and education level), except that Group 2 tended to be older than the others. 137
150 How Do Slow Fashion Brands Encourage Consumers to Buy and Pay More for Slow Fashion Products? To answer this research question, Study II tested a structural model that specified how each dimension of consumer orientation to slow fashion contributes to creating the perceived customer value toward slow fashion, which subsequently increases a consumer s intention to buy and pay a price premium for slow fashion products. According to the customer value creation framework, when the total perceived benefits outweigh the total perceived costs, customer value is generated (Khalifa, 2004; Zeithaml, 1988). Since firms that are capable of creating and offering superior value make it possible to position themselves favorably in the market, the customer value positively influences consumer s purchase decision (Holbrook, 1999; Lai, 1995; Woodruff, 1997; Zeithaml, 1988). In this structural model, therefore, the perceived customer value is viewed as a salient factor to determine consumer s purchase intention and willingness to pay a price premium. First of all, this study hypothesized the positive relationships between each dimension of consumer orientations to the slow fashion (i.e., Equity, Authenticity, Functionality, Localism and Exclusivity) and the perceived customer value on the slow fashion products. H1 proposed that Equity orientation predicts the perceived customer value on slow fashion products, yet H1 was not supported (γ 11 = 0.157, t=1.273, p >.05). The plausible reason of this result may be that people tend to engage in ethical consumption when the ethical issue directly impacts them (Carrigan & Attalla, 2001). Though people are aware of the fact that slow fashion enhances worker s welfare, it does 138
151 not contribute to creating perceived value toward slow fashion products because they may regard that the concerns about compensation and working environment for workers does not directly affect them. H2 posited that consumers who are oriented to Authenticity through hand craftsmanship and traditional construction methods perceive more value on slow fashion products, but H2 was not supported (γ 12 = 0.289, t= 0.716, p>.05). In fact, making clothing by hand craftsmanship and traditional techniques is associated with enhancing product quality as seen in the Raleigh Denim case. This study measured the overall customer value perception toward slow fashion by aggregating four dimensions of the value (emotional, quality, price and social value). The Authenticity dimension may create customer values related to quality, but may not be related to other dimensions of customer values such as price and social value, which may result in the insignificant path coefficient in H2. Thus, investigation of the relationships with each sub-dimension of customer value is recommended to further strengthen the reasoning. H3 was also not supported (γ 13 = 0.249, t= 1.474, p>.05), which predicted the relationship between the Functionality orientation and perceived customer value on slow fashion products. Considering that the long product lifespan reflects product durability (Hatem, 2011; Johansson, 2010), which is a notable contrast to fast fashion, the Functionality orientation should be positively associated with the quality aspect of the slow fashion value perception. However, as in H2, insignificant results may have resulted due to the overall perceived customer value assessed in this study. Indeed, even if consumers valued slow fashion as high quality, other perceived value dimensions such as 139
152 emotional pleasure or affordable price of fast fashion can undermine the overall positive value perception toward slow fashion. In H4, the positive relationship between the Localism orientation and customer value perception was hypothesized, but it was not supported (γ 14 = , t= , p>.05). This implies that local production with local materials does not matter to general apparel consumers in the evaluation of slow fashion value. This relationship can be verified by the same logic used in H1. That is, consumers may be less likely to perceive local production as a direct benefit to them. In fact, local production is largely emphasized in the slow food movement. Since available raw materials of food vary from region to region, and distinctive local tradition and culture are embedded in the food, local food production enables people to enjoy diverse foods (Nilsson, Svärd, Widarsson, & Wirell, 2011; Tencati & Zsolnai, 2012). Also, providing consumers with freshness and high quality is an important reason for local food purchases (Zepeda & Deal, 2009). In contrast, it is hard to connect the local concept as a direct benefit to consumers in the case of apparel products because clothing is not related to freshness, and distinctiveness from locally produced raw material is not readily noticeable. H5 stated that the Exclusivity orientation as an antecedent of creating the perceived customer value in the slow fashion context. Findings revealed that consumers who seek product exclusivity in their apparel purchases are likely to perceive higher value on slow fashion than fast fashion, supporting H5 (γ 15 = 0.284, t= 2.035, p<.05). This finding implies that developing exclusive apparel products may be the most important requirement of slow fashion in competing with fast fashion. By satisfying 140
153 consumers needs toward exclusive products, slow fashion brands may generate superior value over fast fashion brands. Study II also hypothesized the positive relationship between perceived customer value and marketing outcomes, including purchase intention (H6) and willingness to pay a price premium (H7). Supporting the customer value creation framework, H6 and H7 confirmed that people who perceived customer value toward slow fashion products showed higher purchase intention (β 21 = 0.785, t= , p<.001) and willingness to pay higher prices for slow fashion products (β 31 = 0.190, t= 2.059, p<.05). These results were consistent with previous studies (Sweeney & Soutar, 2001; Yang & Peterson, 2004). Interestingly, the modification indices suggested an additional path from purchase intention to price premium intention (β 32 = 0.705, t= 7.112, p<.001). Given the higher coefficient of purchase intention to willingness to pay a price premium (0.705) than that of perceived customer value to willingness to pay a price premium (0.190), this study can conclude that enhancing purchase intention is important to encourage consumers to pay a price premium. In other words, once a consumer is willing to buy slow fashion products, he/she is more likely to pay additional money for the slow fashion products. In sum, the findings of this hypotheses test revealed the Exclusivity dimension of slow fashion contributes to create perceive value toward slow fashion products, which leads to purchase and willingness to pay price premium for slow fashion products. Additionally, consumers purchase intention was found to lead consumers to pay a price premium for slow fashion products. 141
154 Implications Thus far, this study conceptualized the slow fashion concept, profiled potential slow fashion consumer segments, and tested hypotheses proposed based on the customer value creation framework. The findings of this study have a number of implications. The following section discusses the theoretical implications and practical implications of this study. Theoretical Implications First, despite the growing interest of the apparel industry in slow fashion, the academic understanding of the slow fashion concept has been limited. Before this dissertation, the formal definition of slow fashion did not exist, and lack of studies investigated the slow fashion concept from the theoretical perspectives. Bridging the research gaps, this study first attempted to define slow fashion theoretically through identifying underlying dimensions of slow fashion. The five dimensions found in this study will facilitate the future study on slow fashion. Second, this study was based on empirical testing of slow fashion. To find relevant dimensions of slow fashion, three surveys were conducted to student and nonstudent samples in the Southeast region of the U.S., as well as to a nationwide general sample. Since the majority of the previously existing literature was exploratory and conceptual (Clark, 2008; Fletcher, 2010; Pookulangara & Shephard, 2013; Watson & Yan, 2013), the empirical testing of slow fashion will enrich the body of knowledge of slow fashion studies. 142
155 Third, the clarification of the slow fashion concept revealed a conceptual similarity and distinction with existing sustainability concepts in the apparel industry. Although it was certain that slow fashion improves environmental and social sustainability, no theoretical evidences confirmed the associations. In this study, the Exclusivity, Authenticity, Functionality, Localism and Exclusivity dimensions of slow fashion clearly showed how each dimension is related to environmental and social sustainability through a statistical comparison with relevant scales (i.e., the environmental apparel consumption scale and socially responsible consumption scale). The findings indicated that while the Equity dimension was highly correlated to existing sustainable concepts, other dimensions had low to moderate correlations with them. Especially, in the Functionality and Exclusivity dimensions, fairly low correlations were revealed with the sustainability concepts. Therefore, the slow fashion concept is distinctively different from the notion of environmental and social aspects of sustainability in terms of longevity and versatility of clothing (Functionality dimension), and scarce and unique value of clothing (Exclusivity dimension). Fourth, this study provided understanding of slow fashion consumers. Until this dissertation, academic understanding of slow fashion was lacking, as some practical articles mainly focused on the business aspect of slow fashion as an introduction of new movement in the apparel industry. As a first attempt to profile potential slow fashion consumers, this study examined personal value, apparel consumption behaviors and demographic characteristics of potential target slow fashion consumers; therefore, the profiles may provide fundamental information for marketing strategies in the slow 143
156 fashion context. Especially, personal value disposition was guided by the Schwartz value types. The Schwartz value types are very strong tool used to measure personal value (Lindeman & Verkasalo, 2005; Ma & Lee 2012), and they did well to explain different personal value characteristics of each consumer segment identified in this study. No previous studies attempted to understand the characteristics of potential slow fashion consumers with the Schwartz values. In this sense, consumer profiles by the Schwartz values would help a comprehensive understanding of potential consumers underlying value dispositions. Fifth, this study empirically tested how consumer orientation to slow fashion contributes to the creation of customer value, and how customer value affects purchase decisions. This study deemed that perceived customer value is a salient determinant for increasing consumer s purchase intention and willingness to pay a price premium. y substantiating consumer orientation-perceived customer value-positive marketing outcomes, the proposed model in this study that was developed based on the customer value creation model will shed light on developing the slow fashion business model theoretically, which will help slow fashion firms to encourage consumers to buy their products and pay a price premium. In particular, since this model included purchase and price premium intentions that were developed from customer value, the customer value creation model specified in this study can be applicable to research on consumers of ecofriendly clothing, or fair-trade products where price premium is required. 144
157 Practical Implications This study also contributes to provide prominent implications to practitioners and marketers. First, the consumer profiling conducted in this study will assist the implementation of sophisticated and targeted marketing by offering fundamental and comprehensive information of potential slow fashion consumers. Especially, consumer profiles based on personal values will help marketers to better understand their target consumers, since consumers decision making is largely dependent on their value disposition (Huber et al., 2001). For example, the traditional group (Group 2), which can be potential slow fashion consumers, was found to be older than the other groups, and the value dispositions tended to be other-oriented and conservative. In consideration of these findings, marketers can highlight environmentally and socially sustainable aspects of slow fashion products to appeal the traditional consumers. In addition, selling high quality and durable designs for several fashion seasons may help to encourage this consumer group to buy and pay more, seeing that subjects in this group showed the highest orientation in the Functionality aspect of slow fashion. Also, their conservative values may indicate the preference for wearing a piece of clothing longer. Therefore, a firm may provide repair services to enhance durability of the clothing. By contrast, to appeal to the exclusivity oriented consumers (Group 3), the slow fashion firms may focus on differentiation from others and variety seeking in their products, in that this group was oriented toward the Exclusivity dimension of slow fashion. In addition, their tendency to power and stimulation values may be consistent with their Exclusivity orientation. Moreover, together with the amount of apparel 145
158 purchases, the exclusivity oriented consumers may have high fashion involvement; thus, satisfying their fashion needs is required. Advertisements focusing on sustainability and classic design of slow fashion may not entice the exclusivity oriented consumers. Even if the traditional group (Group 2) and the exclusivity oriented group (Group 3) are regarded as promising slow fashion consumers in this study, the distinctive consumer characteristics of the profiles imply that the marketer s approach to each consumer segment should be different. Second, the structural model of customer value creation suggests a guideline to offset an inevitable high pricing of slow fashion. In the current apparel industry, fast fashion brands are eager to target an affordable pricing and clothing prices of the U.S. market have been lowered (American Apparel & Footwear Association, 2009); thus, the higher price range of slow fashion than fast fashion and mass-produced commodities may prevent U.S. consumers from slow fashion purchases. The findings of this study verified that the perceived customer value of slow fashion is a key motivator for purchase intention and willingness to pay a higher price. To increase the customer value, satisfying consumer orientation to Exclusivity was found to be the most significant factor in this study. This gives a valuable lesson to the slow fashion firms. That is, when the firms introduce clothing that offers exclusive value to their consumers through small-batch production, limited special edition, or unique design products, consumers may perceive that the item is worth paying additional money. For instance, Raleigh Denim, which is the denim jeans brand introduced in Chapter II, emphasizes that each pair of jeans is one of a small batch by limiting the number of items of each line. Moreover, the brand marks 146
159 individual serial numbers on each piece of denim jeans to show uniqueness and limited availability of the product. Given constantly growing revenue of the brand (NC SBTDC, 2012), such exclusive value may stimulate consumers to pay $300 for a pair of Raleigh denim jeans. Likewise, for sustainable business, the slow fashion firms should focus on creating exclusive value on their products, which fast fashion and other competitors cannot achieve. In order to create exclusivity, the firms may invest in developing unique designs and limited editions. More importantly, slow fashion should be produced slowly, allowing the limited quantity production. Third, with regard to acceptable amount of price premium as compared to the fast fashion products, this study found that potential slow fashion consumers (i.e., the slow fashion oriented consumer, the traditional consumer and the exclusivity oriented consumer) are willing to spend 20-40% more to buy slow fashion products. Given that over 85% of total participants of this study were regarded as potential slow fashion consumers, this amount of price premium is a very valuable indication for the slow fashion firms. From this finding, it is recommended that the price premium of the slow fashion product should not exceed 40% higher than the fast fashion products. Also, it indicates that 20% of price premium is quite acceptable, as this study found that potential consumers are willing to pay at least 20% of price premium. Fourth, the findings of this study may suggest a way to foster the U.S. domestic apparel industry. In spite of the importance of the exclusive value of slow fashion items for successful businesses, the current apparel industry has heavily relied on offshore manufacturing, which tend toward fashion basic items produced under mass production. 147
160 In fact, far distance of production makes it difficult to reflect on up-to-date demand (Dana, Hamilton, & Pauwels, 2007). Thus, to deliver enhanced exclusivity of slow fashion, domestic manufacturing would be more beneficial. That is, by capitalizing on local skilled artisans, and entrepreneurial young designers, high quality designs can be achieved within the U.S. For this, government should launch policies and supporting programs to foster entrepreneurial and local apparel businesses. Such efforts to improve the exclusivity of slow fashion may eventually lead to fashion diversity that is based on a number of entrepreneurial designers, rather than driven by mass merchants. Limitations and Suggestions for Future Research Through limitations found in this study, this section aims to suggest more opportunities for future studies that can be derived from the slow fashion ideas. First, this study aimed to identify underlying dimensions of slow fashion following Churchill s (1979) paradigm developing measurement. Through three different samples (i.e., student and non-student samples in the Southeast region of the U.S., and a nationwide general sample), the reliability and validity of the developed scale was confirmed in this study, yet more surveys with various samples are required in order to enhance reliability and validity of the developed scale. Nonetheless, considering that no such measures existed in the previous literature, development of these measures was deemed to be a good start elucidating the concepts and dimensions of slow fashion. Second, since this study only targeted a nationwide U.S. sample, the findings may have not been applicable to other countries; therefore, cross-cultural investigation is needed to enhance the generalizability of this study. Given that a number of slow 148
161 initiatives have emerged in different countries such as the U.K., consumer orientation and attitude, or perception toward slow fashion may differ by different cultural influences. In this sense, potential slow fashion consumer groups and their profiles may be different between the U.S. and other countries. Cross-cultural studies can further compare the structural model of the customer value creation on slow fashion products. The finding of this comparison may contribute to evidence for assessing a potential marketability in the international expansion of the slow fashion brands. Third, this study measured the overall perceived customer value of slow fashion products for the parsimonious model, rather than evaluating emotional, quality, price and social value separately. The aggregation may affect the results of the hypotheses test. Though examining how consumer orientation to slow fashion affects each dimension of customer value was beyond the scope of this study, future studies may verify the relationships between each of the five slow fashion orientations and the four customer value dimension. Testing the relationships may provide more detailed information in the customer value creation of slow fashion products. In the long term, this study can serve as a valuable starting point for developing consumer education programs and government policies, which acknowledge the necessities for achieving sustainability. Given that the erstwhile approach to sustainability has focused less on reducing consumption levels, consumer education program should encourage apparel consumers to change their consumption patterns toward reducing consumption volume and the amount of waste. For example, for special occasions, rental clothing items can be an alternative to reduce consumption and waste 149
162 amount. For everyday looks, slow consumption may contribute to reducing apparel consumption levels. Furthermore, due to heavily reliance on offshore manufacturing, American young and independent designers have trouble seeking appropriate manufacturers and retailers to produce and buy their designs, even in spite of their entrepreneurial spirit and creativity (Rantisi, 2002). By contrast, European countries, such as Italy and France, have entrepreneurial apparel supply chains by organizing innovative networks of small scale businesses. They mainly focus on craftsmanship and unique fashion products (Doeringer & Crean, 2006). Considering the size of the U.S., the apparel supply chains can be structured on a local scale. If slow fashion is implemented by independent designers in the local community and the designers are capable to create innovative ideas, contributions to enhance designs and revive local businesses can be achieved. Ultimately, the slow fashion practice can foster the sustainable development of the U.S. apparel industry and the U.S. economy. 150
163 REFERENCES Aaker, D. A. (1996). Measuring brand equity across products and markets. California Management Review, 38(3), Adams, W. M. (2006). The future of sustainability: Re-thinking environment and development in the twenty-first century. The World Conservation Union. Retrieved from American Apparel & Footwear Association. (2009). Trends: An annual statistical analysis of the U.S. apparel & footwear industries. Arlington, VA., Retrieved from Anderson, J. C., & Gerbing, D. V. (1988). Structural equation modeling in practice: A review and recommended two-step approach. Psychological Bulletin, 103(3), Anderson, J. C., Narus, J. A., & Van Rossum, W. (2006). Customer value propositions in business markets. Harvard Business Review, 84(3). Retrieved from Andrews, D., Nonnecke, B., & Preece, J. (2003). Electronic survey methodology: A case study in reaching hard-to-involve internet users. International Journal of Human- Computer Interaction, 16(2), Armstrong, J. S., & Overton, T. S. (1977). Estimating nonresponse bias in mail surveys. Journal of Marketing Research, 4(3), Bagozzi, R.P., Yi, Y., & Phillips, L.W. (1991). Assessing construct validity in organizational research. Administrative Science Quarterly, 36(3), Balch, O. (2013, May). H&M: Can fast fashion and sustainability ever really mix? The Guardian. Retrieved from 151
164 Bhardwaj, V., & Fairhurst, A. (2010). Fast fashion: Response to changes in the fashion industry. The International Review of Retail, Distribution and Consumer Research, 20(1), Biemann, C. (2009). Jeans from North Carolina are 98% local. Springwise. Retrieved from Bilsky, W., & Schwartz, S. H. (1994). Values and personality. European Journal of Personality, 8(3), Butler, S. M., & Francis, S. (1997). The effects of environmental attitudes on apparel purchasing behavior. Clothing and Textiles Research Journal, 15(2), Byun, S., & Sternquist, B. (2008). The antecedents of in-store hoarding: Measurement and application in the fast fashion retail environment. The International Review of Retail, Distribution and Consumer Research, 18(2), Carrigan, M., & Attalla, A. (2001). The myth of the ethical consumer Do ethics matter in purchase behaviour? Journal of Consumer Marketing, 18(7), Cataldi, C., Dickson, M., & Grover, C. (2010). Slow fashion: Tailoring a strategic approach towards sustainability. (Master s thesis, Blekinge Institute of Technology, Sweden). Retrieved from /slowfashion.pdf Churchill, G. (1979). A paradigm for developing better measures of marketing construct. Journal of Marketing Research, 16(1), Clark, H. (2008). SLOW + FASHION: An oxymoron or a promise for the future? Fashion Theory, 12(4), Claudio, L. (2007). Waste couture. Environmental Health Perspectives, 115(9), A449- A454. Retrieved from Cline, E. L. (2012). Overdressed: The shockingly high cost of cheap fashion. New York, NY: The Penguin Group. 152
165 Cooper, T. (2005). Slower consumption: Reflections on product life spans and the Throwaway society. Journal of Industrial Ecology, 9(1-2), Cotton Incorporated. (2013, May). Fast transformation: Sustainability grows among fashion chains. WWD. Retrieved from news/textiles/fast-transformation-sustainability-grows-among-fashion-chains Cotton Incorporated Lifestyle Monitor. (2013). Cotton incorporated 2013 environment survey. Retrieved from Custaldo, S., Perrini, F., Misani, N., & Tencati, A. (2009). The missing link between corporate social responsibility and consumer trust: The case of fair trade products. Journal of Business Ethics, 84(1), Dana, L. P., Hamilton, R. T., & Pauwels, B. (2007). Evaluating offshore and domestic production in the apparel industry: The small firm s perspective. Journal of International Entrepreneurship, 5(3/4), Dasmohapatra, S. (2005). Understanding customer value in the oriented strandboard industry (Doctoral dissertation, The Pennsylvania State University). Retrieved from E186A9606/1?accountid=14604 Day, G. S. (1990). Market driven strategy. New York, NY: Free Press. De Groot, J. I. M., & Steg, L. (2008). Value orientations to explain beliefs related to environmental significant behavior: How to measure egoistic, altruistic, and biospheric value orientations. Environment and Behavior, 40(3), De Pelsmacker, P., Driesen, L., & Rayp, G. (2005). Do consumers care about ethics? Willingness to pay for fair-trade coffee. The Journal of Consumer Affairs, 39(2), Dickson, M. A. (1999). US consumers knowledge of and concern with apparel sweatshops. Journal of Fashion Marketing and Management, 3(1),
166 Dickson, M. A. (2000). Personal values, beliefs, knowledge, and attitudes relating to intentions to purchase apparel from socially responsible businesses. Clothing and Textiles Research Journal, 18(1), Dickson, M., Cataldi, C., & Grover, C. (2013). The slow fashion movement: Reversing environmental damage. Not just a label. Retrieved from Dickson, M. A., & Littrell, M. A. (1996). Socially responsible behavior: Values and attitudes of the alternative trading organization consumer. Journal of Fashion Marketing and Management, 1(1), Dillman, D. A., Smyth, J. D., & Christian, L. M. (2008). Internet, mail, and mixed-mode surveys: The tailored design method (3 rd Ed.). New York, NY: John Wiley & Sons, Inc. Doeringer, P., & Crean, S. (2006). Can fast fashion save the US apparel industry? Socio- Economic Review, 4(3), Domina, T., & Koch, K. (1998). Environmental profiles of female apparel shoppers in the Midwest, USA. Journal of Consumer Studies & Home Economics, 22(3), Doran, C. J. (2009). The role of personal values in fair trade consumption. Journal of Business Ethics, 84(4), Eggert, A., & Ulaga, W. (2002). Customer perceived value: A substitute for satisfaction in business markets? Journal of Business & Industrial Marketing, 17(2/3), Eisend, M. (2008). Explaining the impact of scarcity appeals in advertising: The mediation role of perceptions of susceptibility. Journal of Advertising, 37(3), Fletcher, K. (2007). Slow fashion. Ecologist, 37(5), 61. Fletcher, K. (2008). Sustainable fashion and textiles: Design journeys. London, UK: Routledge. 154
167 Fletcher, K. (2010). Slow fashion: An invitation for systems change. Fashion Practice, 2(2), Fornell, C., & Larcker, D. F. (1981). Evaluating structural equation models with unobservable variables and measurement error. Journal of Marketing Research, 18(1), Fuchs, D. A., & Lorek, S. (2005). Sustainable consumption governance: A history of promises and failures. Journal of Consumer Policy, 28(3), Gale, B. T. (1994). Managing customer value: Creating quality and service that customer can see. New York, NY: Free Press. Gallarza, M. G., & Saura, I. G. (2006). Value dimensions, perceived value, satisfaction and loyalty: An investigation of university students travel behavior. Tourism Management, 27(3), Gam, H. J. (2011). Are fashion-conscious consumers more likely to adopt eco-friendly clothing? Journal of Fashion Marketing and Management, 15(2), Gam, H. J., Cao, H., Farr, C., & Kang, M. (2010). Quest for the eco-apparel market: A study of mothers willingness to purchase organic cotton clothing for their children. International Journal of Consumer Studies, 34(6), Ghemawat, P., & Nueno, J. L. (2003). ZARA: Fast fashion. Boston, MA: Harvard Business School. Retrieved from Global Reporting Initiative. (2011). Sustainable reporting guidelines. Retrieved from Protocol.pdf Gonsalves, R. (2012). Fast fashion slows down: Less damaging designs on the high street. The Independent. Retrieved from 155
168 Goodland, R. (1995). The concept of environmental sustainability. Annual Review of Ecology and Systematics, 26, Goworek, H. (2011). Social and environmental sustainability in the clothing industry: A case study of a fair trade retailer. Social Responsibility Journal, 7(1), Gunther, M. (2013). Levi Strauss seeks to slow down fast fashion with sustainable practices. The guardian. Retrieved from Hair, J. F., Black, W. C., Babin, B. J., & Anderson, R. E. (2009). Multivariate data analysis (7 th Ed.). Upper Saddle River, NJ: Prentice Hall. Halepete, J., Littrell, M., & Park, J. (2009). Personalization of fair trade apparel: Consumer attitudes and intentions. Clothing and Textiles Research Journal, 27(2), Hatem, S. (2011). Raleigh denim spreads the gospel of craftsmanship. News Observer. Retrieved from Hiller Connell, K. Y. (2011). Exploring consumers perceptions of eco-conscious apparel acquisition behaviors. Social Responsibility Journal, 7(1), Hiller Connell, K. Y., & Kozar, J. M. (2012). Sustainability knowledge and behaviors of apparel and textile undergraduates. International Journal of Sustainability in Higher Education, 13(4), Holbrook, M. B. (2006). Consumption experience, customer value, and subjective personal introspection: An illustrative photographic essay. Journal of Business Research, 59(6), Huber, F., Herrmann, A., & Morgan, R. E. (2001). Gaining competitive advantage through customer value oriented management. Journal of Consumer Marketing, 18(1),
169 Hustvedt, G., & Dickson, M. (2009). Consumer likelihood of purchasing organic cotton apparel: Influence of attitudes and self-identity. Journal of Fashion Marketing and Management, 13(1), Hutchins, M. J., & Sutherland, J. W. (2008). An exploration of measures of social sustainability and their application to supply chain decisions. Journal of Cleaner Production, 16(15), Jin, B., Chang, H. J., Matthews, D., & Gupta, M. (2011). Fast fashion business model: What, why and how? In T.M. Choi (Eds.), Fashion Supply Chain Management: Industry and Business Analysis (pp ). Hershey, PA: IGI Global. Johansson, E. (2010). Slow fashion: The answer for a sustainable fashion industry? (Master s thesis, University of Borås, Sweden). Retrieved from Kahle, L. R. (1983). Social values and social change: Adaptation to life in America. Westport, CT: Praeger. Khalifa, A. S. (2004). Customer value: A review of recent literature and an integrative configuration. Management Decision, 42(5), Kim, H., Choo, H. J., & Yoon, N. (2013). The motivational drivers of fast fashion avoidance. Journal of Fashion Marketing and Management, 17(2), Kim, H-S. & Damhorst, M. L. (1998). Environmental concern and apparel consumption. Clothing and Textiles Research Journal, 16(3), Kim, S., Littrell, M. A., & Paff Ogle, J. L. (1999). The relative importance of social responsibility as a predictor of purchase intentions for clothing. Journal of Fashion Marketing and Management, 3(3), Kline, R. B. (2011). Principles and practice of structural equation modeling (3 rd Ed.). New York, NY: Guilford Press. Lai, A. W. (1995). Consumer values, product benefits and customer value: A consumption behavior approach. Advances in Consumer Research, 22,
170 Laroche, M., Bergeron, J., & Barbaro-Forleo, G. (2001). Targeting consumers who are willing to pay more for environmentally friendly products. Journal of Consumer Marketing, 18(6), LeBlanc, S. (2012). Sustainable fashion design: Oxymoron no more? BSR. Retrieved from Lindeman, M., & Verkasalo, M. (2005). Measuring values with the short Schwartz s value survey. Journal of Personality Assessment, 85(2), Littrell, M. A., & Ma, Y. J., & Halepete, J. (2005). Generation X, baby boomers, and swing: Marketing fair trade apparel. Journal of Fashion Marketing and Management, 9(4), Lohse, G. L., Bellman, S., & Johnson, E. J. (2000). Consumer buying behavior on the Internet: Findings from panel data. Journal of Interactive Marketing, 14(1), Ma, Y. J., & Lee, H-H. (2012). Understanding consumption behaviors for fair trade nonfood products: Focusing on self-transcendence and openness to change values. International Journal of Consumer Studies, 36(6), MacCallum, R. C., Browne, M. W., & Sugawara, H. M. (1996). Power analysis and determination of sample size for covariance structure modeling. Psychological Methods, 1(2), Machlin, G. (2013, July). Fast fashion has to slow down. Triple Pundit. Retrieved from Malhotra, N. K. (2009). Marketing research: An applied orientation (6 th Ed.). Upper Saddle River, NJ: Prentice Hall. Maslow, A. H. (1954). Motivation and personality. New York, NY: Harper. Mayer, H., & Knox, P. L. (2006). Slow cities: Sustainable places in a fast world. Journal of Urban Affairs, 28(4),
171 McDougall, G. H. G., & Levesque, T. (2000). Customer satisfaction with services: Putting perceived value into the equation. Journal of Services Marketing, 14(5), McKenzie, S. (2004). Social sustainability: Towards some definitions. Hawke Research Institute, Working Paper Series, No 27. Retrieved from McManus, P. (1996). Contested terrains: Politics, stories and discourses of sustainability. Environmental Politics, 5(1), Monroe, K. B. (1990). Pricing-marketing profitable decision. New York, NY: McGraw- Hill. Morgan, L. R., & Birwistle, G. (2009). An investigation of young fashion consumers disposal habits. International Journal of Consumer Studies, 33(2), Muthén, B., & Kaplan, D. (1985). A comparison of some methodologies for the factor analysis of non-normal Likert variables. British Journal of Mathematical and Statistical Psychology, 38(2), NC SBTDC. (2012). Raleigh Denim: An annual report of Retrieved from Niinimäki, K. (2010). Eco-clothing, consumer identity and ideology. Sustainable Development, 18(3), Niinimäki, K., & Hassi, L. (2011). Emerging design strategies in sustainable production and consumption of textiles and clothing. Journal of Cleaner Production, 19(16), Nilsson, J. H., Svärd, A., Widarsson, Å., & Wirell, T. (2011). Cittáslow ecogastronomic heritage as a tool for destination development. Current Issues in Tourism, 14(4), Normann, R., & Ramírez, R. (1993). From value chain to value constellation: designing interactive strategy. Harvard Business Review, 71(4),
172 Nunnally, J. C., & Bernstein, I. H. (1994). Psychometric theory (3 rd Ed.). New York, NY: McGraw-Hill. Oliver, R. L. (1977). Effects of expectation and disconfirmation on postexposure product evaluations: An alternative interpretation. Journal of Applied Psychology, 62(4), Parasuraman, A. (1997). Reflections on gaining competitive advantage through customer value. Journal of the Academy of Marketing Science, 25(2), Pepper, M., Jackson, T., & Uzzell, D. (2009). An examination of the values that motivate socially conscious and frugal consumer behaviours. International Journal of Consumer Studies, 33(2), Phelan, H. (2012). The slow fashion movement: 10 brands that are doing it right. Fashionista. Retrieved from Pookulangara, S., & Shephard, A. (2013). Slow fashion movement: Understanding consumer perceptions- An exploratory study. Journal of Retailing and Consumer Services, 20(2), Punj, G., & Stewart, D. W. (1983). Cluster analysis in marketing research: Review and suggestion for application. Journal of Marketing Research, 20(2), Rallapalli, K. C., Vitell, S. J., Wiebe, F. A., & Barnes, J. H. (1994). Consumer ethical beliefs and personality traits: An exploratory analysis. Journal of Business Ethics, 13(7), Ramjohn, K. (2008). Some terminology & definitions: Sustainability, land use & impact assessment. Retrieved from Rantisi, N. M. (2002). The competitive foundations of localized learning and innovation: The case of women s garment production in New York City. Economic Geography, 78(4),
173 Rao, A., R., & Bergen, M. E. (1992). Price premium variations as a consequence of buyers lack of information. Journal of Consumer Research, 19(3), Ravald, A., & Grönroos, C. (1996). The value concept and relationship marketing. European Journal of Marketing, 30(2), Rivoli, P. (2009). The travels of a T-shirt in the global economy: an economist examines the markets, power and politics of world trade. Hoboken, NJ: John Wiley & Sons, Inc. Rokeach, M. (1973). The nature of human value. New York, NY: Free Press. Ross, R. J. S. (2004). Slaves to fashion: Poverty and abuse in the new sweatshops. Ann Arbor, MI: The University of Michigan Press. Rudell, F. (2006). Shopping with a social conscience: Consumer attitudes toward sweatshop labor. Clothing and Textiles Research Journal, 24(4), Schwartz, S. H. (1992). Universals in the content and structure of values: Theoretical advances and empirical tests in 20 countries. Advances in Experimental Social Psychology, 25, CA: Academic Press, Inc. Schwartz, S. H. (1994). Are there universal aspects in the structure and contents of human values? Journal of Social Issues, 50(4), Schwartz, S. H. (2003). Chapter 7. A proposal for measuring value orientations across nations. Questionnaire development report of the European Social Survey (pp ). Retrieved from ESS_core_questionnaire_human_values.pdf Schwartz, S. H., & Bilsky, W. (1987). Toward a universal psychological structure of human values. Journal of Personality and Social Psychology, 53(3), Seyfang, G. (2006). Ecological citizenship and sustainable consumption: Examining local organic food networks. Journal of Rural Studies, 22(4),
174 Shaw, D., Hogg, G., Wilson, E., Shui, E., & Hassan, L. (2006). Fashion victim: The impact of fair trade concerns on clothing choice. Journal of Strategic Marketing, 14(4), Shim, S. (1995). Environmentalism and consumers clothing disposal patterns: An exploratory study. Clothing and Textiles Research Journal, 13(1), Slow Fashioned. (2012). Slow Food USA. (2013). Smith, J. B., & Colgate, M. (2007). Customer value creation: A practical framework. Journal of Marketing Theory and Practice, 15(1), Solomon, M. (2011). Consumer behavior- Buying, having and being (9 th Ed. ). Upper Saddle River, NJ: Prentice Hall. Solomon, M., & Rabolt, N. J. (2004). Consumer behavior: In fashion. Upper Saddle River, NJ: Prentice Hall. Sorescu, A., Frambach, R. T., Singh, J., Rangaswamy, A., & Bridges, C. (2011). Innovations in retail business models. Journal of Retailing, 87(1S), S3-S16. Steenhaut, S., & Van Kenhove, P. (2006). An empirical investigation of the relationships among a consumer s personal values, ethical ideology and ethical beliefs. Journal of Business Ethics, 64(2), Steenkamp, J-B., Hofstede, F., & Wedel, M. (1999). A cross-national investigation into the individual and national cultural antecedents of consumer innovativeness. Journal of Marketing, 63(2), Steenkamp, J. E. M., Van Heerde, H. J., & Geyskens, I. (2010). What makes consumers willing to pay a price premium for national brands over private labels? Journal of Marketing Research, 47(6), Sull, D., & Turconi, S. (2008). Fast fashion lessons. Business Strategy Review, 19(2),
175 Sustainable Apparel Coalition. (2013). Sweeney,. (2012). Patagonia s incent Stanley on sustainable apparel. Chicago Business. Retrieved from nias-vincent-stanley-on-sustainable-apparel Sweeney, J. C., & Soutar, G. N. (2001). Consumer perceived value: The development of a multiple item scale. Journal of Retailing, 77(2), Sweeney, J. C., Soutar, G. N., & Johnson, L. W. (1999). The role of perceived risk in the quality-value relationship: A study in a retail environment. Journal of Retailing, 75(1), Tencati, A., & Zsolnai, L. (2012). Collaborative enterprise and sustainability: The case of slow food. Journal of Business Ethics, 110(3), Thøgersen, J., & Ö lander, F. (2002). Human values and the emergence of a sustainable consumption pattern: A panel study. Journal of Economic Psychology, 23(5), Tian, K. T., Bearden, W. O., & Hunter, G. L. (2001). Consumers need for uniqueness: Scale development and validation. Journal of Consumer Research, 28(1), Ulaga, W., & Chacour, S. (2001). Measuring customer perceived value in business market: A prerequisite for marketing strategy development and implementation. Industrial Marketing Management, 30(6), United Nations. (1987). Our common future: Report of the World Commission on Environment and Development. Retrieved from 02.htm#I United Nations. (1992). Agenda 21. Retrieved from United Nations. (2005). General assembly World summit outcome. Retrieved from 163
176 U.S. Bureau of Economic Analysis. (2012). Personal consumption expenditures by major type of product. Retrieved from =3&isuri=1&910=x&911=0&903=65&904=1960&905=2013&906=a U.S. Bureau of Labor Statistics. (2012). Spotlight on Statistics. Retrieved from U.S. Census Bureau. (2011). Age and sex composition: Retrieved from Wahba, P., & Skariachan, D. (2013, August). How fast fashion brands are beating the 3As in US. ABS-CBN News. Retrieved from Wang, G., Dou, W., & Zhou, N. (2008). Consumption attitudes and adoption of new consumer products: A contingency approach. European Journal of Marketing, 42(1/2), Watson, M. Z., & Yan, R-N. (2013). An exploratory study of the decision processes of fast versus slow fashion consumers. Journal of Fashion Marketing and Management, 17(2), Webb, D. J., Mohr, L. A., & Harris, K. E. (2008). A re-examination of socially responsible consumption and its measurement. Journal of Business Research, 61(2), White, R. (2012). Slow style vs. fast fashion. Good, 20, Retrieved from Wilson, G., & Baldassare, M. (1996).Overall sense of community in a suburban region: The effects of localism, privacy, and urbanization. Environment and Behavior, 28 (1), Woodruff, R. B. (1997). Customer value: The next source for competitive advantage. Journal of the Academy of Marketing Science, 25(2),
177 Workman, J. E., & Lee, S-H. (2011). Materialism, fashion consumers and gender: A cross-cultural study. International Journal of Consumer Studies, 35(1), Wright, K. B. (2005). Researching internet-based populations: Advantages and disadvantages of online survey research, online questionnaire authoring software packages, and web survey services. Journal of Computer-Mediated Communication, 10(3), 00. DOI: /j tb00259.x Wu, L., Cai, Y., & Liu, D. (2011). Online shopping among Chinese consumers: An exploratory investigation of demographics and value orientation. International Journal of Consumer Studies, 35(4), Yang, Z., & Peterson, R. T. (2004). Customer perceived value, satisfaction, and loyalty: The role of switching costs. Psychology & Marketing, 21(10), Yun, G. W., & Trumbo, C. W. (2000). Comparative response to a survey executed by post, , & web form. Journal of Computer-Mediated Communication, 6(1), 0. DOI: /j tb00112.x Zeithaml, V. A. (1988). Consumer perceptions of price, quality, and value: A means-end model and synthesis of evidence. Journal of Marketing, 52(3), Zepada, L., & Deal, D. (2009). Organic and local food consumer behaviour: Alphabet theory. International Journal of Consumer Studies, 33(6),
178 APPENDIX A SURVEY QUESTIONNAIRE 166
179 Please circle the number that best describes your level of agreement about each statement. Strongly Strongly disagree agree 1 I am concerned about the working conditions of producers when I buy clothes Handcrafted clothes are more valuable than mass-produced ones I tend to keep clothes as long as possible rather than discarding quickly Fair compensation for apparel producers is important to me when I buy clothes I value clothes made by traditional techniques I believe clothes made of locally produced materials are more valuable I am concerned about fair trade when I buy clothes I prefer simple and classic designs Limited editions hold special appeal for me We need to support U.S. apparel brands I prefer buying clothes made in U.S. to clothes manufactured overseas I am very attracted to rare apparel items I enjoy having clothes that others do not I often enjoy wearing the same clothes in multiple ways Craftsmanship is very important in clothes Please circle the number that best describes your level of agreement about each statement. Strongly Strongly disagree agree 1 I buy apparel made from recycled material I buy second-hand apparel I purposely select fabrics that require cooler washing temperature, shorter drying time, or less ironing I avoid an apparel product because of environmental concerns I select apparel that I can wear over a longer term compared to trendy apparel that goes out of style quickly I buy clothing made of organically grown natural fibers I buy apparel with low impact or no dye processing I buy apparel with environmentally friendly labeling or packaging techniques
180 Please circle the number that best describes your level of agreement about each statement. Strongly Strongly disagree agree 1 I try to buy from companies that help the needy I try to buy from companies that hire people with disabilities I avoid buying products or services from companies that discriminate against minorities When given a chance to switch to a retailer that supports local schools, I take it I try to buy from companies that make donations to medical research I make an effort to buy from companies that sponsor food drives When given a chance to switch to a brand that gives back to the community, I take it I avoid buying products made using child labor When given a chance, I switch to brands where a portion of the price is donated to charity When I am shopping, I try to buy from companies that are working to improve conditions for employees in their factories. 11 I try to buy from companies that support victims of natural disasters I make an effort to buy products and services from companies that pay all of their employees a living wage I avoid buying products or services from companies that discriminate against women
181 How important is each value as a guiding principle in your life? Please circle the number that best describes your level of agreement about each statement. Not important at all very important 1 Equality Inner Harmony Social Power Pleasure Freedom A Spiritual Life Sense of Belonging Social Order An Exciting Life Meaning in Life Politeness Wealth National Security Self-respect Reciprocation of Favors Creativity A World at Peace Respect for Tradition Mature Love Self-discipline Detachment Family Security Social Recognition Unity with Nature A Varied Life Wisdom Authority True Friendship A World of Beauty Social Justice Independent Moderate Loyal Ambitious Broad-minded Humble Daring Protecting the Environment
182 39 Influential Honoring of Parents and Elders Choosing Own Goals Healthy Capable Accepting My Portion in Life Honest Preserving My Public Image Obedient Intelligent Helpful Enjoying Life Devout Responsible Curious Forgiving Successful Clean Please circle the number that best describes your apparel shopping experiences. The following questions are asking about clothing purchases for you. On average, how many apparel products do you purchase in a month? [1] 0-1 [2] 2-3 [3] 4-5 [4] 6-10 [5] 11+ On average, how much do you spend for clothing in a month? [1] $0-$20 [2] $21-$50 [3] $51-$100 [4] $101-$200 [5] $201+ When you decide that clothing is no longer of use, what do you do? Please circle the number that best describes your level of agreement about each option. Never Sometimes All of the Time 1 Have the item mended Hand the item down Store the item regardless of usage Donate the item Swap the item Resell the item Discard the item
183 The fast fashion concept is that garments are produced fast, sold fast, and thrown away fast. The fast fashion brands include Zara, H&M, Forever 21, and Topshop. What % of your total clothing is purchased in the fast fashion brands? % What % of the total money you spend on clothing purchases is spent for fast fashion brand clothing? % Slow fashion is to slow down the fashion cycle from fast fashion. That is, the slow fashion concept is that garments are produced slowly and thrown away slowly. The underlying concept of slow fashion is consistent with the slow food movement, which pertains to being aware of the environment and producers by enjoying traditionally and locally made foods. B The slow fashion brands are Raleigh Denim, Carrie Parry, Lily Ashwell and Imogene+Willie. Based on the information above, please circle the number that best describes your level of agreement about each statement. Strongly Strongly disagree agree Compared to fast fashion, you perceive that a slow fashion product. 1 Has consistent quality Is well made Has an acceptable standard of quality Has poor workmanship Would not last a long time Would perform consistently Is one that I would enjoy Would make me want to use it Is one that I would feel relaxed about using Would make me feel good Would give me pleasure Is reasonably priced Offers value for money Is a good product for the price Would be economical Would help me to feel acceptable Would improve the way I am perceived Would make a good impression on other people Would give its owner social approval
184 Please circle the number that best describes your level of agreement. Strongly Strongly disagree agree 1 I would consider buying slow fashion products I will purchase slow fashion products There is a strong likelihood that I will buy slow fashion products Please circle the number that best describes your level of agreement. Strongly Strongly disagree agree 1 Buying slow fashion products seems smart to me even if they cost more. 2 I am ready to pay a higher price for slow fashion products I would still buy slow fashion products if other brands reduced their prices. How much more are you willing to pay for slow fashion products compared to the price of fast fashion products? [0] nothing [1] 10% more [2] 20% more [3] 30% more [4] 40% more [5] 50% more (1.5 times as much) [6] 75% more [7] 100% more (twice as much) [8] More than twice as much The following information will remain confidential and will be used for statistical purposes only. What is your age? [ ]years old What is your gender? [ ]Female [ ]Male What is your marital status? [ ]Married [ ]Unmarried What is the highest level of education you have completed? [1] High school or less [2] Some college [3] Bachelor [4] Masters/some graduate school [5] Doctorate What is your ethnicity? [1] African American [2] American Indian [3] Asian [4] Caucasian/Anglo/European American [5] Hispanic/Latino [6] Mixed What was your individual income in the year 2012? [1] $19,999 or less [2] $20,000-39,999 [3] $40,000-59,999 [4] $60,000-79,999 [5] $80,000-99,999 [6] $100,000 or above Please indicate the state in which you are currently living. [ ] 172
185 APPENDIX B IMAGES OF FAST FASHION BRANDS 173
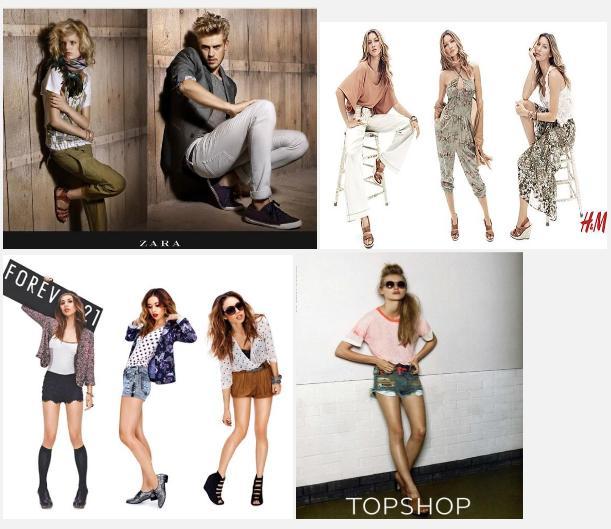
186 174
187 APPENDIX C IMAGES OF SLOW FASHION BRANDS 175

188 176
189 APPENDIX D APPROVAL OF INSTITUTIONAL REVIEW BOARD: A STUDENT SAMPLE SURVEY 177
190 178
191 179
192 180
193 181
194 APPENDIX E APPROVAL OF INSTITUTIONAL REVIEW BOARD: A NON-STUDENT SAMPLE SURVEY 182
195 183
196 184
197 185
198 APPENDIX F APPROVAL OF INSTITUTIONAL REVIEW BOARD: A NATIONWIDE SAMPLE SURVEY 186
199 187
200 188
201 189
202 APPENDIX G DENDROGRAM BY THE HIERARCHICAL CLUSTER ANALYSIS 190
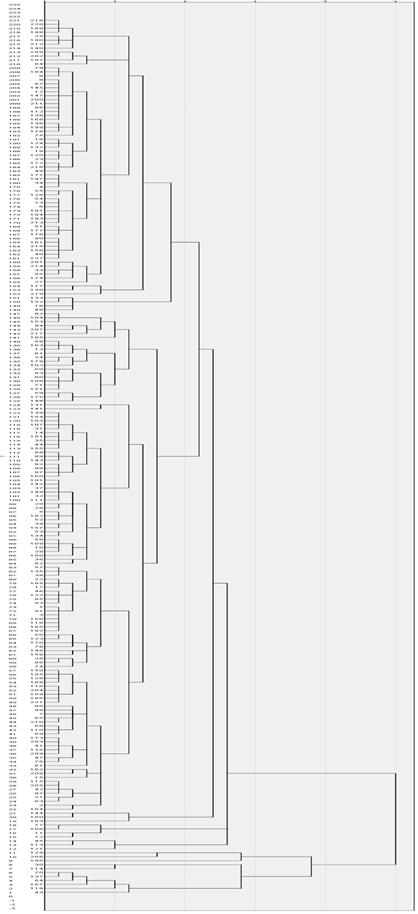
203 191
The Sustainable Future of the Fashion Industry
 Dominican University of California Dominican Scholar Scholarly & Creative Works Conference 2017 Scholarly and Creative Works Conference 2017 Apr 20th, 5:35 PM - 6:00 PM The Sustainable Future of the Fashion
SAC S RESPONSE TO THE OECD ALIGNMENT ASSESSMENT
 SAC S RESPONSE TO THE OECD ALIGNMENT ASSESSMENT A Collaboration Between the Sustainable Apparel Coalition and the Organisation for Economic Cooperation and Development February 13, 2019 A Global Language
Retail Product Merchandising: Retail Buying-Selling Cycle
 Retail Product Merchandising: Retail Buying-Selling Cycle SECTION 2: Establishing the Retail Merchandise Mix Part 1: The Basics of the Retail Merchandise Mix Part 1: 1-6 Trend Modifiers Trend modifiers
Levi Strauss & Co: Reimagining Product Innovation for Sustainability
 SUSTAINABLE BRANDS CASE STUDY Levi Strauss & Co: Reimagining Product Innovation for Sustainability By: Kelly Cook December 2014 "There are all of these nodes of activities being recalibrated in response
Conscious Actions Highlights 2015
 WELCOME Conscious Actions Highlights 2015 We think H&M s approach, which seeks to improve the lives of workers and their children across a comprehensive range of issues involving the supply chain and beyond,
NATIONAL TEXTILE AND APPAREL RECOVERY INITIATIVE
 NATIONAL TEXTILE AND APPAREL RECOVERY INITIATIVE KEY FACTS Globally, we produce 2.1 BT of waste per year, more than 1.6 times earth s long-term production capacity. At this rate, we will generate 62% more
New design and business models for sustainable consumption:
 New design and business models for sustainable consumption: Group 4 Kira Van den Ende Andrea Taylor Janika Magi Maja Cornelius Pauliina Varis Silvia Gonzalez Table of Contents 1.Topic Selection 2.Problem
Cilotex CIRCULAR LOGISTICS A NEED FOR MORE TRACEABILITY? JAN MERCKX
 Cilotex CIRCULAR LOGISTICS A NEED FOR MORE TRACEABILITY? JAN MERCKX Photographs are courtesy of Fabrice Montero The Prophecy Agenda Is there a need to have more transparency in the fashion and textile
Overview of Taiwan Textile Industry 2013
 Overview of Taiwan Textile Industry 2013 2014.04 A. Status of Taiwan Textile Industry At the beginning stage, Taiwan textile industry imported raw materials for processing and exported most of the finished
SAC MEMBERSHIP. 82 Second Street, San Francisco, CA 94105
 SAC MEMBERSHIP 82 Second Street, San Francisco, CA 94105 Vision MEMBERSHIP OVERVIEW An apparel, footwear and textile industry that produces no unnecessary environmental harm and has a positive impact on
State of. Reuse. Report
 2018 State of Reuse Report Style Comes Full Circle pg. 3 Introduction Since commissioning the inaugural State of Reuse Report in 2016, we have seen variations in consumer behavior across the reuse cycle
The Higg Index 1.0 Index Overview Training
 The Higg Index 1.0 Index Overview Training Presented by Ryan Young Index Manager, Sustainable Apparel Coalition August 20 th & 21 st, 2012 Webinar Logistics The webinar is being recorded for those who
State of. Reuse. Report
 2018 State of Reuse Report Style Comes Full Circle pg. 1 Introduction Since commissioning the inaugural State of Reuse Report in 2016, we have seen variations in consumer behavior across the reuse cycle
Clothing longevity and measuring active use
 Summary Report Clothing longevity and measuring active use Results of consumer research providing a quantitative baseline to measure change in clothing ownership and use over time. This will inform work
CONsCIOUs ACTIONs Highlights 2012
 CONSCIOUS ACTIONS Highlights 2012 Welcome to H&M s CONSCIOUS ACTIONS Highlights 2012 At H&M, we think of sustainability as a word of action. It s an ongoing journey full of heart, drive and passion with
2. The US Apparel and Footwear Market Size by Personal Consumption Expenditure,
 1 TABLE OF CONTENTS 1. The US Apparel and Footwear Market Introduction 2. The US Apparel and Footwear Market Size by Personal Consumption Expenditure, 2005-2010 3. The US Apparel and Footwear Per Capita
Research on Branded Garment Design from the Perspective of Fashion Information
 2017 International Conference on Social Sciences, Arts and Humanities (SSAH 2017) Research on Branded Garment Design from the Perspective of Fashion Information Yixuan Guo School of Business Administration,
COMPETENCIES IN CLOTHING AND TEXTILES NEEDED BY BEGINNING FAMILY AND CONSUMER SCIENCES TEACHERS
 Journal of Family and Consumer Sciences Education, Vol. 20, No. 1, Spring/Summer, 2002 COMPETENCIES IN CLOTHING AND TEXTILES NEEDED BY BEGINNING FAMILY AND CONSUMER SCIENCES TEACHERS Cheryl L. Lee, Appalachian
COMMUNICATION ON ENGAGEMENT DANISH FASHION INSTITUTE
 COMMUNICATION ON ENGAGEMENT DANISH FASHION INSTITUTE PERIOD: 31 OCTOBER 2015 31 OCTOBER 2017 STATEMENT OF CONTINUED SUPPORT BY CHIEF EXECUTIVE 31 October 2017 To our stakeholders, It is a pleasure to confirm
Master's Research/Creative Project Four Elective credits 4
 FASHION First offered fall 2010 Curriculum Master of Arts (MA) Degree requirements Course title Credits Master's Research/Creative Project Milestone Four Elective credits 4 Course code Course title Credits
Secondhand Clothing Recovery, Recycle & Reuse Industry
 Secondhand Clothing Recovery, Recycle & Reuse Industry CTR s Mission: Create awareness about keeping what we wear out of landfills in order to divert significant quantities of pctw from national and local
About the Report. Booming Women Apparel Market in India
 About the Report "Booming Women Apparel Market in India" is the new report by that give a rational analysis on the Indian women apparel industry. This report has been made to help the client in analyzing
Shopping and Us (1) Chapter 1
 Chapter 1") Shopping and Us (1) Did you know...? Read the following statements. Mark each one as Positive (+), Negative ( ) or Neutral (n). Then, circle the facts that surprised you. Compare your responses with your
Shopping and Us (1) Did you know...? Read the following statements. Mark each one as Positive (+), Negative ( ) or Neutral (n). Then, circle the facts that surprised you. Compare your responses with your
ALASKA GROSS STATE PRODUCT
 ALASKA GROSS STATE PRODUCT 1961-1998 by Scott Goldsmith Professor of Economics prepared for Alaska Department of Commerce and Economic Development June 1999 Institute of Social and Economic Research University
Case Study Example: Footloose
 Case Study Example: Footloose Footloose: Introduction Duraflex is a German footwear company with annual men s footwear sales of approximately 1.0 billion Euro( ). They have always relied on the boot market
Higher National Unit Specification. General information for centres. Fashion: Commercial Design. Unit code: F18W 34
 Higher National Unit Specification General information for centres Unit title: Fashion: Commercial Design Unit code: F18W 34 Unit purpose: This Unit enables candidates to demonstrate a logical and creative
Overview of the Global Textile Industry
 Overview of the Global Textile Industry Bangladesh Cotton & Textile Convention 2007 Dhaka, Bangladesh Topics To Be Considered Global Trends The Trade/Sourcing Outlook Impact of China Market Requirements
COTTON VERSUS SYNTHETICS THE CONSUMER PERSPECTIVE. A. Terhaar Cotton Council International, Washington, D.C., USA
 COTTON VERSUS SYNTHETICS THE CONSUMER PERSPECTIVE A. Terhaar Cotton Council International, Washington, D.C., USA ABSTRACT This article purports to further the argument presented by the author at the 2010
Current cotton fiber market in Russia
 Current cotton fiber market in Russia By Mr. Sechko M.S., President of «Russian Cotton Association» NP One of the priorities of economic growth and national safety of the country in developing market model
Global Fast Fashion Market with Focus on The United States: Size, Trends & Forecast ( ) June 2016
 June 2016") Global Fast Fashion Market with Focus on The United States: Size, Trends & Forecast (2016-2020) June 2016 Global Fast Fashion Market with Focus on The United States Report Scope of the Report The report
Global Fast Fashion Market with Focus on The United States: Size, Trends & Forecast (2016-2020) June 2016 Global Fast Fashion Market with Focus on The United States Report Scope of the Report The report
The UK market is doubling in value every 2 years, and in 2007 reached an estimated retail value of 493 million. The UK is one of the world s leading
 Fair Trade Fairtrade is about better prices, decent working conditions, local sustainability, and fair terms of trade for farmers and workers in the developing world. By requiring companies to pay sustainable
It is a great pleasure to see so many of you here today. I will talk about last year, but also tell you a little bit about our plans ahead.
 Dear Shareholders, It is a great pleasure to see so many of you here today. I will talk about last year, but also tell you a little bit about our plans ahead. At H&M we always focus on the customer and
Vision. Current Focus
 sac membership membership overview Vision An apparel, footwear, and textile industry that produces no unnecessary environmental harm and has a positive impact on the people and communities associated with
TEXTILE EXCHANGE INSIGHTS SERIES: PREFERRED COTTON
 TEXTILE EXCHANGE INSIGHTS SERIES: PREFERRED COTTON The first of a series of insights from the 2016 Preferred Fiber & Materials (PFM) Benchmark program launches this month with a focus on cotton. In March
Sampling Process in garment industry
 Sampling Process in garment industry Sampling is one of the main processes in garment manufacturing and it plays vital role in attracting buyers and confirming the order, as the buyers generally places
Market Analysis. Summary
 Market Analysis Summary Jewelry manufacturing in the U.S. has seen sharp declines in recent years due to strong foreign competition. Many developing countries are in a good position to provide products
Lesson Plan for Teaching Module Title: Ethics and Consumer Protection in Fashion Marketplace
 Lesson Plan for Teaching Module Title: Ethics and Consumer Protection in Fashion Marketplace Prepared by Young Ha, PhD Assistant Professor Department of Family and Consumer Sciences California State University,
APPAREL, MERCHANDISING AND DESIGN (A M D)
") Apparel, Merchandising and Design (A M D) 1 APPAREL, MERCHANDISING AND DESIGN (A M D) Courses primarily for undergraduates: A M D 120: Apparel Construction Techniques (3-0) Cr. 3. SS. Assemble components
Apparel, Merchandising and Design (A M D) 1 APPAREL, MERCHANDISING AND DESIGN (A M D) Courses primarily for undergraduates: A M D 120: Apparel Construction Techniques (3-0) Cr. 3. SS. Assemble components
Case study example Footloose
 Case study example Footloose Footloose Introduction Duraflex is a German footwear company with annual men s footwear sales of approximately 1.0 billion Euro( ). They have always relied on the boot market
PEOPLE AND PLANET. Content. T-shirt. Sweatshirt Half-zip p. 25 Crew neck p Full-zip p Hoodie p Pants p. 39. CSR p.
 2017 PEOPLE AND PLANET Content off T-shirt Round neck p. 6-11 V-neck p. 12-13 Long sleeve p. 14-17 Polo Short sleeve p. 18-19 Long sleeve p. 22-23 Sweatshirt Half-zip p. 25 Crew neck p. 29-31 Full-zip
Careers and Income Opportunities
 Careers and Income Opportunities http://www.fashion-schools.org/fashion-designer.htm Fashion Designer Fashion designers conceptualize and create new clothing and accessory designs. They analyze fashion
Mehdi Mahbub CEO & Chief Consultant, Best Sourcing Founder, RMG Bangladesh GLOBAL TRENDS IN THE GARMENT SECTOR AND OPPORTUNITIES FOR BANGLADESH
 GLOBAL TRENDS IN THE GARMENT SECTOR AND OPPORTUNITIES FOR BANGLADESH TECHNOLOGICAL CHANGES AND INNOVATIONS IN THE WORLD BANGLADESH READYMADE GARMENT INDUSTRY, the 2 nd largest apparel exporter of the world:
Collecting Textiles: Make It Work for Your Community
 Collecting Textiles: Make It Work for Your Community Your Name Your Company Name SMART Member Date Today s Definition of Acceptable Textiles to be Recycled Any clothing, household textile or commercial
From fiber to apparel: closing loops along the value chain Robert van de Kerkhof, Chief Commercial Officer. Fashion Summit HK, 7 th September 2017
 From fiber to apparel: closing loops along the value chain Robert van de Kerkhof, Chief Commercial Officer Fashion Summit HK, 7 th September 2017 Fashion industry has a great growth potential Source: McKinsey
Growth and Changing Directions of Indian Textile Exports in the aftermath of the WTO
 Growth and Changing Directions of Indian Textile Exports in the aftermath of the WTO Abstract A.M.Sheela Associate Professor D.Raja Jebasingh Asst. Professor PG & Research Department of Commerce, St.Josephs'
CHAPTER Introduction
 CHAPTER 1 1. Introduction This section will talk about the background of this research, the problem statement and the aim and purpose of this research. Also, a few literature review, the scope and method
The Go-To Sourcing Destination: Vietnam Continues to Lure U.S. Firms. SOURCING at MAGIC August 14, 2017
 The Go-To Sourcing Destination: Vietnam Continues to Lure U.S. Firms SOURCING at MAGIC August 14, 2017 About the United States Fashion Industry Association (USFIA) Our Mission The United States Fashion
Investment Opportunities in the Design Industry in Taiwan
 Investment Opportunities in the Design Industry in Taiwan I. Industry Definition and Scope The Cultural and Creative Industry Policy in Taiwan has delineated the domestic design service industry into three
PRODUCT Materials. Quarterly Reported Metrics Q Results. Gold/Silver Rated Leather
 PRODUCT Materials Quarterly Reported Metrics Q4 2017 Results Volatile Organic Compounds 55 52 53 52 50 42 Gold/Silver Rated Leather 93.4% 93.1% 94.1% 93.7% 88.6% 58% 87% Cotton 81% 77% 82% 2016 Q1 2017
Textile and Apparel Management
 Textile and Apparel Management 1 Textile and Apparel Management Pam Norum, Department Chair and Professor 137 Stanley Hall (573) 882-7317 http://tam.missouri.edu Advising Contact Jaime Mestres 122 Stanley
Comparison of Women s Sizes from SizeUSA and ASTM D Sizing Standard with Focus on the Potential for Mass Customization
 Comparison of Women s Sizes from SizeUSA and ASTM D5585-11 Sizing Standard with Focus on the Potential for Mass Customization Siming Guo Ph.D. Program in Textile Technology Management College of Textiles
Fashion Enter. Southampton, May 2014 Foster eco-innovation and social responsibility in the T&C industry
 Fashion Enter Southampton, 14-15 May 2014 Foster eco-innovation and social responsibility in the T&C industry Hopkins, Padovani, Whittaker WSA, University of Southampton 1 Context British Fashion Council
Turkish Textiles and Apparel Industry
 Turkish Textiles and Apparel Industry 29.11.2018 The Textile & Apparel Industries In View of the Turkish Economy The textiles & apparel industries are the leading industries in manufacturing and employment
Consumer and Market Insights: Skincare Market in France. CT0027IS Sample Pages November 2014
 Consumer and Market Insights: Skincare Market in France CT0027IS Sample Pages November 2014 Example table of contents Introduction Category classifications Demographic definitions Summary methodology Market
1. Global Production and Trade of Raw Jute and Jute Goods: A Low Level Equilibrium Market 2. Production and Export of Jute and Jute Goods in Banglades
 Interactive Workshop on Gender Sensitization in the Jute Sector-Bangladesh Organised by International Jute Study Group (IJSG), Dhaka 24 February, 2011 Gender Disparity or Gender Parity Is There Any Difference
100% LEADING THE CHANGE
 100% LEADING THE CHANGE OVERVIEW VISION & STRATEGY 100% CIRCULAR & RENEWABLE 100% FAIR & EQUAL STANDARDS & POLICIES H&M GROUP SUSTAINABILITY REPORT 2017 16 OF 100 H&M. KEY FACTS & FIGURES / EXPLAINED /
US Denim Jeans Market Report
 US Denim Jeans Market Report ----------------------------------------- 2015 Executive Summary Denim has become a wardrobe staple for the comfort it offers and above all for being one of the best clothing
Title Page Textile Waste in Skagit County Program Proposal. Emily Cone and Whitaker Jamieson. WWU Office of Sustainability
 Title Page Textile Waste in Skagit County Program Proposal Emily Cone and Whitaker Jamieson WWU Office of Sustainability 1 Table of Contents Title Page 1 Table of Contents 2 Executive Summary 3 Statement
The Business of Textile and Fashion
 The Business of Textile and Fashion Ladok code: 51FÖ01 The exam is given to: DTEKO13 Exam Code: Date of exam: 2015-03-25 Time: 09.00-13.00 Means of assistance: Calculator Total amount of point on exam:
Global Handbags Market Report
 Global Handbags Market Report ---------------------------------------------------- 2013 Executive Summary Premium handbags and accessories is one of the fastest growing segments in the overall luxury market.
UNIQLO UNIQLO, FUELING CLOTHING INNOVATION
 UNIQLO UNIQLO, FUELING CLOTHING INNOVATION 36 Seamless down has no stitches for the wind to get through so it is super warm. The durable water-repellent fabric and stylish silhouette are key to this product
Standing up for women
 Standing up for women www.sinnfein.ie/budget2018 2 www.sinnfein.ie/budget2018 Sinn Féin is on your side people. Sinn Féin is on your side. Our politics and policies put equality, sound economics and the
CASE STUDY. Staples: Recycled Denim Products. A Marc Howard Project
 CASE STUDY Staples: Recycled Denim Products A Marc Howard Project CLIENT PROFILE Staples is the world s largest office products company and second largest Internet retailer. For 30 years, Staples has served
TO STUDY THE RETAIL JEWELER S IMPORTANCE TOWARDS SELLING BRANDED JEWELLERY
 TO STUDY THE RETAIL JEWELER S IMPORTANCE TOWARDS SELLING BRANDED JEWELLERY Prof. Jiger Manek 1, Dr.Ruta Khaparde 2 ABSTRACT The previous research done on branded and non branded jewellery markets are 1)
Rep the Red Seed ~ 3Strands
 Rep the Red Seed ~ 3Strands 3Strands (powered by Corporate Visions), is a for-profit brand with products made by survivors of human trafficking and those at risk. 3Strands works with artisan partners around
INDIAN JEWELLERY MARKET-METAMORPHOSIS INTRODUCTION
 "A STUDY ON CUSTOMER PREFRENCES-AMONG BRANDED AND NON BRANDED JEWELLERY. Dr. Priyanka Gautam 1 Ms. Urmila Thakur 2 INDIAN JEWELLERY MARKET-METAMORPHOSIS INTRODUCTION Due to rapid progress in the retail
S R I L A N K A APPAREL
 SRI LANKA APPAREL Sri Lanka s Apparel Export Industry is the most significant and dynamic contributor towards the country s economy. The industry has demonstrated a tremendous growth over the past four
China is simply having their comeback.
 Whoever thinks China is an emerging economy in the world is wrong: China is simply having their comeback. MADE IN CHINA Advice Report Shanti Rossa 25 May 2011 Whoever thinks China is an emerging economy
REPUBLIC OF RWANDA MINISTRY OF TRADE, INDUSTRY AND EAC AFFAIRS
 REPUBLIC OF RWANDA MINISTRY OF TRADE, INDUSTRY AND EAC AFFAIRS RESPONSE TO THE REQUEST FOR COMMENTS AND NOTICE OF PUBLIC HEARING CONCERNING AN OUT- OF- CYCLE REVIEW OF RWANDA S ELIGIBILITY FOR BENEFITS
The Denim Industry. When shopping for jeans, individuals have different preferences and needs. Regardless of
 Victoria Malkin Junior, Class of 20 I 0 HOD 2720: Advanced Organizational Theory Fall 2008 The Denim Industry When shopping for jeans, individuals have different preferences and needs. Regardless of style
sass & bide Spring-Summer 2017 Impact Assessment ITC Ethical Fashion Initiative: Artisan.Fashion October-November, 2016
 sass & bide Spring-Summer 2017 Impact Assessment ITC Ethical Fashion Initiative: Artisan.Fashion October-November, 2016 This order was monitored using the RISE framework an innovative scheme developed
THE CHARACTERISTICS OF SUPERMARKET SHOPPERS IN JAKARTA
 Supervisor INTERNATIONAL UNDERGRADUATE PROGRAM BINA NUSANTARA UNIVERSITY Major Marketing Sarjana Ekonomi Thesis Even semester year 2007 THE CHARACTERISTICS OF SUPERMARKET SHOPPERS IN JAKARTA ( In the case
Future of Sustainability in Fast Fashion
 1 Anni Härtsiä Future of Sustainability in Fast Fashion Helsinki Metropolia University of Applied Sciences Bachelor of Business Administration Double Degree Programme in European Business Administration
PRODUCT Materials. Quarterly Reported Metrics Q Results. Gold/Silver Rated Leather
 PRODUCT Materials Quarterly Reported Metrics Q1 2018 Results 51 52 Volatile Organic Compounds 42 Gold/Silver Rated Leather 93.1% 96.4% 81% 81% Cotton 2017 Q1 2018 Q2 2018 Q3 2018 Q4 2018 2020 Avg. grams
FAST RETAILING a modern Japanese company and proud owner of the UNIQLO brand - inspires the world to dress casual.
 a modern Japanese company and proud owner of the UNIQLO brand - inspires the world to dress casual. I am Tadashi Yanai, the Chairman and CEO of. I would like to share with you my thoughts on where I see
EASTERN KENTUCKY UNIVERSITY HAZARD COMMUNICATION PROGRAM SUMMARY COMPLIANCE MANUAL. Table of Contents
 EASTERN KENTUCKY UNIVERSITY HAZARD COMMUNICATION PROGRAM SUMMARY COMPLIANCE MANUAL Table of Contents I. OVERVIEW OF THE HAZARD COMMUNICATION STANDARD A. Background and Scope.................................
Cost of Production. {Earth Systems & Resources
 Cost of Production {Earth Systems & Resources Objectives Students will: Explain various factors that might contribute to a company s sourcing decisions Describe real-life working conditions Weigh the pros
Fashion Merchandising and Design. Fashion Merchandising and Design 10
 Fashion Merchandising and Design Fashion Merchandising and Design Fashion Merchandising and Design brings to life the business aspects of the fashion world. It presents the basics of market economics,
Session 10. Sourcing and Supplier Management Practices
 Session 10 Sourcing and Supplier Management Practices 1 Outline Introduction: HK Apparel Industry Environment of HK s Apparel Industry Merchandising Management Sourcing Fashion Merchandising organisations
INDIAN APPAREL MARKET OUTLOOK
 INDIAN APPAREL MARKET OUTLOOK Market Size by Apparel Type, Gender and Region Trends and Forecast Till 2021 www.fibre2fashion.com 1 ABOUT US Fibre2fashion.com was established in 2000 and is owned and promoted
THE CHANGING WORLD TEXTILE MARKET
 THE CHANGING WORLD TEXTILE MARKET Leo Yung Central Textiles (HK) Limited, Hong Kong Ladies and Gentlemen, it is a great honour for me to be invited to speak at this conference. Before I begin, I would
Exploring consumers perceptions of eco-conscious apparel acquisition behaviors
 This is the author s final, peer-reviewed manuscript as accepted for publication. The publisher-formatted version may be available through the publisher s web site or your institution s library. Exploring
Proactive Fashion Design and New Green Business Thinking
 Proactive Fashion Design and New Green Business Thinking Kirsi Niinimäki Aalto University, School of Arts, Design and Architecture, Design Research, NODUS, Sustainable Design Products configure consumer
A COMPARISON BETWEEN CONSUMER AND INDUSTRY PERSPECTIVES ON SUSTAINABLE PRACTICES THROUGHOUT THE APPAREL PRODUCT LIFE CYCLE.
 A COMPARISON BETWEEN CONSUMER AND INDUSTRY PERSPECTIVES ON SUSTAINABLE PRACTICES THROUGHOUT THE APPAREL PRODUCT LIFE CYCLE by Xingqiu Lou A thesis submitted to the Faculty of the University of Delaware
STUDENT ESSAYS ANALYSIS
 Fashion Essay By Caitlin Barbieri 2ND PLACE ANALYSIS Characters: Kevin Almond: Currently Kevin works at the University of Huddersfield as the Head of the Department for Fashion and Textiles. Kaitlin A.
For- Credit Courses and Certificate Programs in Apparel Merchandising & Management for Industry Professionals
 For- Credit Courses and Certificate Programs in for Industry Professionals C A L P O L Y P O M O N A Fall 2013 1. Certificate in Apparel Manufacturing* (16 quarter units over 9 months) Perhaps surprisingly,
notable celebrities, Zara customers truly hold high opinions of the brand. Overall, Zara seeks to satisfy its consumers by way of providing top- of- t
 Zara: Advertising Strategy Evaluation and Development Currently one of the largest retailers in the world, Zara is a fast- fashion retailer that provides moderately priced, yet exceedingly chic and luxurious
DEBS TEXTILE CORPORATION COMPANY PROFILE
 DEBS TEXTILE CORPORATION COMPANY PROFILE Creating Inspirational Fabrics Silky, Supple, Elegant. A Rich Variety. Timeless Quality. Who We Are Debs Textile Corporation is a manufacturer and seller of textile
FACTS & NUMBERS 2016
 FACTS & NUMBERS 2016 STATISTICAL ANALYSIS 2015 Portugal exported 79 million pairs of shoes, valued at 1 865 million euros. 2015 was the sixth consecutive year with growth in footwear exports Exports have
2017 Chinese Home Textile Industry Development. and the Trend Analysis
 Sources: http://www.chinaidr.com/tradenews/2017-12/116930.html 2017 Chinese Home Textile Industry Development and the Trend Analysis 1. The home textile industry is picking up at an accelerating pace Affected
NW Bicester Eco-Town. Steve Hornblow, Project Director A2Dominion
 NW Bicester Eco-Town Steve Hornblow, Project Director A2Dominion About A2Dominion The A2Dominion Group is one of the country s leading providers of high-quality housing for sale, shared ownership and rent.
The Growing Niche Market of Plus-Size Apparel. Topic Area: Other Areas of Social Science. Presentation Format: Poster
 The Growing Niche Market of Plus-Size Apparel Topic Area: Other Areas of Social Science Presentation Format: Poster Delana Foster, Undergraduate Student Department of Marketing and Management The University
Introduction 2. Mission of Statement Organizational Resources & Opportunities.. 4. Analysis of the Environment SWOT Analysis.
 Table of Contents Introduction 2 10 12 13 14 Mission of Statement... 3 Organizational Resources & Opportunities.. 4 Analysis of the Environment... 5 SWOT Analysis. 6 Organizational and Marketing Objectives.
Fairfield Public Schools Family Consumer Sciences Curriculum Fashion Merchandising and Design 10
 Fairfield Public Schools Family Consumer Sciences Curriculum Fashion Merchandising and Design 10 Fashion Merchandising and Design 10 BOE Approved 05/09/2017 1 Fashion Merchandising and Design Fashion Merchandising
Fashion Designers
 http://www.bls.gov/oco/ocos291.htm Fashion Designers * Nature of the Work * Training, Other Qualifications, and Advancement * Employment * Job Outlook * Projections Data * Earnings * OES Data * Related
STATISTICAL ANALYSIS 2015
 FACTS & NUMBERS STATISTICAL ANALYSIS 2015 Portugal exported 79 million pairs of shoes, valued at 1 865 million euros. 2015 was the sixth consecutive year with footwea exports growth Exports grew by 1.1%
What is econometrics? INTRODUCTION. Scope of Econometrics. Components of Econometrics
 1 INTRODUCTION Hüseyin Taştan 1 1 Yıldız Technical University Department of Economics These presentation notes are based on Introductory Econometrics: A Modern Approach (2nd ed.) by J. Wooldridge. 14 Ekim
The Portrayal Of Female Fashion Magazine (Rayli) And Chinese Young Women s Attitudinal And Behavioral Change
 And Chinese Young Women s Attitudinal And Behavioral Change") The Portrayal Of Female Fashion Magazine (Rayli) And Chinese Young Women s Attitudinal And Behavioral Change Performance of Composer Name Surname Wanxing Chen Advisor Asst. Prof. Dr. Suwannee Luckanavanich
The Portrayal Of Female Fashion Magazine (Rayli) And Chinese Young Women s Attitudinal And Behavioral Change Performance of Composer Name Surname Wanxing Chen Advisor Asst. Prof. Dr. Suwannee Luckanavanich
More than just looks, fashion is the understanding of THE practices and culture BEHIND the production and consumption of clothes, our second skin.
 IUAV - master s ESTETHICA: Sustainability in fashion head of course: Maria Luisa Frisa Course content director: Orsola de castro COurse beginning: March 2018 More than just looks, fashion is the understanding
India s Textile Ecosystem
 RAHUL MISHRA India s Textile Ecosystem o Has a major impact on Indian Economy o Is one of the largest sources of employment (employs over 45 million people) o Water and air pollution are major issues in