Clothing Evaporative Resistance: Its Measurements and Application in Prediction of Heat Strain
|
|
|
- Thomas Bishop
- 5 years ago
- Views:
Transcription
.")
1 Clothing Evaporative Resistance: Its Measurements and Application in Prediction of Heat Strain Wang, Faming Published: Link to publication Citation for published version (APA): Wang, F. (2011). Clothing Evaporative Resistance: Its Measurements and Application in Prediction of Heat Strain Lund University (Media-Tryck) General rights Copyright and moral rights for the publications made accessible in the public portal are retained by the authors and/or other copyright owners and it is a condition of accessing publications that users recognise and abide by the legal requirements associated with these rights. Users may download and print one copy of any publication from the public portal for the purpose of private study or research. You may not further distribute the material or use it for any profit-making activity or commercial gain You may freely distribute the URL identifying the publication in the public portal L UNDUNI VERS I TY PO Box L und
2 Take down policy If you believe that this document breaches copyright please contact us providing details, and we will remove access to the work immediately and investigate your claim. Download date: 30. Jun. 2018
3

4 Clothing Evaporative Resistance: Its Measurements and Application in Prediction of Heat Strain Faming Wang Sept Division of Ergonomics and Aerosol Technology Department of Design Sciences Faculty of Engineering, Lund University
5 Clothing Evaporative Resistance: Its Measurements and Application in Prediction of Heat Strain Copyright 2011 Faming Wang Doctoral Thesis Department of Design Sciences Lund University, Sweden Thesis cover designed by Faming Wang and Huilong Wang. ISBN ISSN , Publication No.45 ISRN LUTMDN/TMAT-1025-SE Printed in Sweden by Media-Tryck, Lund University
6 Popular science summary Clothing plays an important role in our lives. It serves four main functions: adornment, status, modesty and protection. Wearing popular clothing with one s favourite decorations, contributes to a person reaching his or her mental comfort. Clothing is also a symbol of status, and was particularly so in ancient times. Moreover, it protects the human body from injury from abrasions, scratches, fire, radiations, and insect bites and helps the body maintaining core temperature. From a heat transfer point of view, clothing acts as a thermal and moisture barrier. In cold weather, it is always good to have such a thermal barrier to prevent body heat loss. But in hot environments, clothing can greatly hinder sweat evaporation and heat dissipation. Construction workers and fire-fighters, for example, should wear protective clothing whatever the environment. They usually have a very high metabolic rate. If the heat produced cannot be balanced by sweat evaporation and/or dry heat losses, their body core temperature will rise. As body heat storage and core temperature increase, work performance will be greatly impaired, and the high body core temperature may eventually threaten their lives. Evaporative resistance is one of the most important factors in quantifying and characterising the role of clothing as a moisture barrier. The research reported in this thesis examined several potential factors that may cause manikin measurement errors in clothing evaporative resistance. The findings can help designers to optimise functional protective clothing. They can also be a help in standardising test protocols and in enhancing measurement accuracy. An example of using clothing evaporative resistance in a heat strain model is given. The results of human trials presented in this thesis provide a picture of how humans physiologically respond to various thermal environments and protective clothing systems. Such studies contribute to the body of knowledge on how human respond to various environments. i
7 ii
8 Abstract Clothing evaporative resistance is one of the most important inputs for both the modelling and for standards dealing with thermal comfort and heat stress. It might be determined on guarded hotplates, on sweating manikins or even on human subjects. Previous studies have demonstrated that the thermal manikin is the most ideal instrument for testing clothing evaporative resistance. However, the repeatability and reproducibility of manikin wet experiments are not very high for a number of reasons such as the use of different test protocols, manikins with different configurations, and different methods applied for calculation. The overall goals of the research presented were: (1) to examine experimental parameters that cause errors in evaporative resistance and to set up a well-defined test protocol to obtain repeatable data; and (2) to apply the reliable clothing evaporative resistance data obtained from manikin measurements and physiological data acquired from human trials to validate the Predicted Heat Strain (PHS) model (ISO 7933). Most of the calculations on clothing evaporative resistance up until now have been based on manikin temperature rather than fabric skin temperature because the fabric skin temperature was unknown. However, the calculated evaporative resistance has been overestimated because the fabric skin temperature is usually lower than the manikin temperature. This is mainly due to that water evaporation cooling down the fabric skin. In Paper I, the error of using manikin temperature instead of fabric skin temperature for evaporative resistance calculation was examined. In Paper II, a universal empirical equation was developed to predict wet skin temperature based on the total heat loss obtained from the manikin and the controlled manikin temperature. Paper III investigated discrepancy between the two options for the calculation of clothing evaporative resistance and how to select one of them for measurements conducted in a so called isothermal condition. Paper IV studied localised clothing evaporative resistance through an inter-laboratory study. The localised dynamic evaporative resistance caused by air and body movement was examined as well. In iii
9 addition, reduction factor equations for localised evaporative resistance at each local segment were established. The thermophysiological responses of eight human subjects who wore five different vocational garments in various warm and hot environments were investigated (Paper V and Paper VI). The PHS model was validated by those human trials. Some suggestions on how to revise this model in order to achieve wider applicability were discussed and proposed. The results showed that the prevailing method for the calculation of evaporative resistance can generate an error of up to 35.9% on the boundary air layer s evaporative resistance R ea. In contrast, it introduced an error of up to 23.7% to the clothing total evaporative resistance R et. The error was dependent on the value of the clothing intrinsic evaporative resistance R ecl. The isothermal condition is the most preferred test condition for measurements of clothing evaporative resistance; the isothermal mass loss method is always the correct option to calculate evaporative resistance. The reduction equations developed for localised clothing evaporative resistance have demonstrated that a total evaporative resistance value provided very limited information for local clothing properties and thus, localised values should be reported. The skin temperatures predicted by the PHS model were greatly overestimated in light clothing and high humidity environments (RH>80%). Similarly, the predicted core temperatures in protective clothing FIRE in warm and hot environments were also largely overestimated. The predicted evaporation rate was always much lower than the observed data. Therefore, a further revision of this model is required. This can be achieved by performing more human subject tests and applying more sensitive mathematical equations. Keywords: sweating thermal manikin, protective clothing, evaporative resistance, localised evaporative resistance, thermophysiological response, heat stress, heat strain, the PHS model iv
10 List of publications and author s contribution This thesis is based on the following papers, which will be referred to in the text by their Roman numerals. The papers are appended at the end of the thesis. I Wang F, Kuklane K, Gao C and Holmér I. Effect of temperature difference between manikin and wet fabric surfaces on clothing evaporative resistance: how much error is there? Int. J. Biometeorol. doi: /s z (2011) I conducted the experiments, analysed the data and wrote the paper. My supervisors made comments and replied to some of the questions raised by reviewers. II Wang F, Kuklane K, Gao C and Holmér I. Development and validity of a universal empirical equation to predict skin surface temperature on thermal manikins. J. Therm. Biol. 35: (2010) I conducted all experiments, analysed the data and wrote the paper. My supervisors made comments and replied to some of the questions raised by reviewers. III Wang F, Gao C, Kuklane K and Holmér I. Determination of clothing evaporative resistance on a sweating thermal manikin in an isothermal condition: heat loss method or mass loss method? Ann. Occup. Hyg. 55: (2011) I designed the test protocols, performed the experiments, analysed the data and wrote the paper. My supervisors commented on the manuscript and replied to some of the questions raised by reviewers. IV Wang F, Ribeiro M, Mayor TS, Lin LY, del Ferraro S, Molinaro V, Gao C, Kuklane K and Holmér I. Localised boundary air layer and clothing evaporative resistance for local body segments. Submitted to Ergonomics, manuscript number TERG v
11 I developed the idea, designed the test protocol, and performed all experiments with Miguel at CeNTI, Simona and Vincenzo at INAIL. I carried out all data analysis and wrote the paper. My supervisors made comments. V Wang F, Kuklane K, Gao C and Holmér I. Can the PHS model (ISO7933) predict reasonable thermophysiological responses while wearing protective clothing in hot environments?. Physiol. Meas. 32: (2011) I conducted all human trials with Kalev and Chuansi. I analysed the data and wrote the paper. We had several discussions before the paper submission. VI Wang F, Gao C, Kuklane K and Holmér I. Effects of various protective garments and thermal environments on physiological heat strain of unacclimated men: the PHS model (ISO 7933) revisited. To be submitted for publication I conducted all human trials with Kalev and Chuansi. I analysed the data and wrote the paper. We had several discussions as well. Papers I, II, III and V have been reprinted with kind permissions from the following publishers: Paper I: Springer, Berlin; Paper II: Elsevier, Amsterdam; Paper III: Oxford University Press, Oxford; Paper V: IOP (Institute of Physics), London. vi
12 Additional papers, not included in the thesis Journal papers 1. Wang F, Gao C, Kuklane K, Holmér I. (2009) A study on evaporative resistance of two new skins designed for thermal manikin Tore under different environmental conditions. J. Fiber Bioeng. Inform. 1: Wang F, Zhou X, Wang S. (2009) Development processes and property measurements of moisture absorption and quick dry fabrics. Fibers Text. East. Eur.17: Wang F. (2010) Comparisons on thermal and evaporative resistances of kapok coats and traditional down coats. Fibers Text. East. Eur. 18: Wang F, Gao C, Kuklane K, Holmér I. (2010) A review on technology of personal heating garments. Int. J. Occup. Safety Ergo. (JOSE) 16: Wang F, Lee H. (2010) Evaluation of an electrically heated vest (EHV) using thermal manikin in cold environments. Ann. Occup. Hyg. 54: Wang F, Wang S. (2010) Characterization on pore size of honeycombpatterned micro-porous PET fibers using image processing techniques. Ind. Textila 61: Wang F, Ji E, Zhou X, Wang S. (2010) Empirical equations for intrinsic and effective evaporative resistances of multi-layer clothing ensembles. Ind. Textila 61: Wang F, Gao C, Holmér I. (2010) Effects of air velocity and clothing combination on heating efficiency of an electrically heated vest (EHV): a pilot study. J. Occup. Environ. Hyg. 7: Wang F, Kuklane K, Gao C, Holmér I, Havenith G. (2010) Development and validation of an empirical equation to predict wet fabric skin surface temperature of thermal manikins. J. Fiber Bioeng. Inform. 3: Kuklane K, Gao C, Wang F, Holmér I. (2011) Parallel and serial thermal insulation calculation methods in European manikin standards. Int. J. Occup. Safety Ergo.(JOSE) submitted vii
13 11. Gao C, Kuklane K, Wang F, Holmér I. (2011) Personal cooling with phase change materials to improve thermal comfort from a heat wave perspective. Indoor Air submitted, manuscript number INA Conference papers 1. Wang F. A comparative introduction on thermal manikins Newton and Walter. Proceedings of the 7th International Thermal Manikin and Modelling Meeting (7I3M), University of Coimbra, Portugal, Sept. 3-5, Wang F. Comparisons on thermal and evaporative resistances of traditional down coats and kapok coats. The 4th European Conference on Protective Clothing (ECPC), Arnhem, Netherlands, June 10-12, Wang F, Gao C, Kuklane K, Holmér I. A study on evaporative resistance of two new skins designed for thermal manikin Tore under different environmental conditions. The 4th European Conference on Protective Clothing(ECPC), Arnhem, Netherlands, June 10-12, Holmér I, Gao C, Wang F. Can a vest provide 83 clo? serial calculation method revisited. The 4th European Conference on Protective Clothing (ECPC), Arnhem, Netherlands, June 10-12, Wang F, Gao C, Holmér I. Effects of air velocity and clothing combination on heating efficiency of an electrically heated vest (EHV). Proceedings of the 13th International Conference on Environmental Ergonomics (XIII ICEE), Boston, Massachusetts, USA, Aug. 2-5, 2009, pp Wang F, Gao C, Kuklane K, Holmér I. A study on evaporative resistance of two new skins designed for thermal manikin Tore under different environmental conditions. Proceedings of Textile Bioengineering and Informatics Symposium (TBIS 2009), Hong Kong, July pp Wang F, Kuklane K, Gao C, Holmér I. Development and validation of an empirical equation to predict sweating skin surface temperature for thermal manikins. Textile Bioengineering and Informatics Symposium Proceedings (TBIS 2010), Shanghai, May 28-30, 2010, pp viii
14 8. Wang F, Kuklane K, Gao C, Holmér I. Development of empirical equations to predict sweating skin surface temperature for thermal manikins in warm environments. Proceedings of the 8th International Thermal Manikin and Modelling Meeting (8I3M), Victoria, Canada, Aug Wang F, Gao C, Kuklane K, Holmér I. Does PHS model predict acceptable skin and core temperatures while wearing protective clothing? Proceedings of the 8th International Thermal Manikin and Modelling Meeting (8I3M), Victoria, Canada, Aug Kuklane K, Gao C, Wang F, Holmér I. European Manikin Standards and Serial Calculation Model in THEM. Proceedings of the 8th International Thermal Manikin and Modelling Meeting (8I3M), Victoria, Canada, Aug Wang F, Kuklane K, Gao C, Holmér I. Effect of different fabric skin combinations on predicted skin temperature on a thermal manikin. Proceedings of the 2nd International Conference on Advanced Textiles Materials & Manufacturing Technology, Hangzhou, Oct. 2010, pp Wang F, Ribeiro M, Mayor TS, Lin L, Del Ferraro S, Molinaro V, Gao C, Kuklane K, Holmér I. Localised evaporative resistance: Correction for body and air movement. Proceedings of the 14th International Conference on Environmental Ergonomics (XIV ICEE), Nafplio, Greece, July 10-15, 2011 pp Gao C, Kuklane K, Wang F, Holmér I. Personal cooling with phase change materials to improve thermal comfort from a global warming perspective. Proceedings of the 14th International Conference on Environmental Ergonomics (ICEE), Nafplio, Greece, July 10-15, 2011, pp Wang F, Gao C, Kuklane K, Holmér I. Determination of localised clothing evaporative resistance on thermal manikins. Young Researchers Forum, the 4th International Conference on Human-Environment System (ICHES 2011), Hokkaido University, Sapporo, Japan, Oct. 3-6, 2011 ix
15 15. Gao C, Wang F, Kuklane K, Holmér I. Personal cooling with phase change materials in a very hot environment. Proceedings of the 4th International Conference on Human-Environment System (ICHE 2011), Hokkaido University, Sapporo, Japan, Oct. 3-6, Wang F, Gao C, Kuklane K, Holmér I. The predicted heat strain model (ISO7933) severely over- or underestimated core and skin temperature in protective clothing and light summer clothing. The 55th Nordic Work Environment Meeting (NAM2011), Lund, Sweden, Oct.17-19, Gao C, Wang F, Sakoi T. Ventilated evaporative cooling as a preventive measure when confronted with climate changes. The 55th Nordic Work Environment Meeting (NAM 2011), Lund, Sweden, Oct.17-19, 2011 Licentiate thesis Wang F. Evaluation of the Performances of Electrically Heated Clothing. ISBN: , E-husets Tryckeri Press, Lund, Sweden, Sept Technical reports 1. A report for a Vinnova (Swedish Government Agency for Innovation Systems) project entitled Development of clothing for extreme environments, and assessment model of thermal protection for different work situations, A report for the Taiwan Textile Research Institute (TTRI) contract entitled Evaluation of cold protective clothing, A report for the Taiwan Textile Research Institute (TTRI) contract entitled An Investigation of sleeping bags using thermal manikins and human subjects, 2011, in preparation x
16 Acknowledgements Eleven years ago, in 2001, I was a teenager entering my first term as a college freshman. This was the first time that I had lived in a big city and I was struggling with my future dream to be a researcher. It wasn t that easy. Today, eleven years later, I am completing my PhD studies at Lund University but am not that young any more. Fortunately, I am now approaching the fulfilment of my early dream. Definitely, this doctoral thesis would not have been possible without the help of those who have contributed and supported me. In particularly, I would like to thank: Prof. Ingvar Holmér, my main supervisor, for introducing and guiding me to the field of science. I really appreciate your patience, fortitude and enormous help. Thank you for being the most wonderful scientist who you are sharing your great scientific and never-ending knowledge in clothing physiology, and for teaching me everything you know on this subject. I admire your ability to straighten things out, making it possible to solve the toughest problems, and the way you explain science. Thank you for giving me so many opportunities to participate international conferences: the ECPC conference in the Netherlands, the TBIS symposium in Shanghai, the 8I3M conference in Canada, and the ICEE conferences in the United States and Greece. These invaluable experiences have broadened my horizon and enhanced my knowledge. I really have enjoyed working with you. Dr. Kalev Kuklane, my co-supervisor, for instructing me on how to conduct both manikin measurements and human physiological tests. For patiently sharing your immense knowledge and showing your skilful experiences in laboratory testing. Thank you very much for sharing your ideas with me and supervising me. You always took time to explain, to discuss and to talk whenever I needed to. I really appreciate your patience and efforts. Thank you for contacting the faculty examiner and committee members, and preparing my oral thesis defence. I wish you good luck in searching for funding as well as in doing future research. xi
17 Dr. Chuansi Gao, my co-supervisor, for your invaluable expertise in the field and for driving this research one step further. I enjoyed discussing with you in the setting up of new experiments and exchanging new ideas. Thanks a million for your enormous help in my daily life. I still remember when you picked us up at Lund s Central Train Station at midnight on our first arrival day. You are so kind and nice! Thank you for driving us to Malmö and introducing us to so many Chinese food stores; for inviting us to your home for Christmas dinners; and for helping me move from Sjöbo to Hässleholm. It is pretty difficult to express my gratitude to you. Dr. Tiago Sotto Mayor, for giving me the chance to conduct manikin experiments at CeNTI (Centre for Nanotechnology and Smart Materials, Vila Nova de Famalicão), Portugal. Thank you also for your valuable comments made on Paper IV; Miguel Ribeiro at CeNTI, for helping me to set up manikin experiments; Dr. Simona del Ferraro and Dr. Vincenzo Molinaro from the INAIL (Italian Workers Compensation Authority, Rome) of Italy, for allowing me to conduct experiments in your laboratory; for picking me up at the Fiumicino International Airport and inviting me to dinners, and I have really enjoyed so many different typical Italian pizzas; Li-Yen Lin at TTRI (Taiwan Textile Research Institute, Taipei), for sharing your manikin data. All my colleagues in the Department of Design Sciences at Lund University: for creating a harmonious working environment and showing smiles. In particular, Prof. Gerd Johansson, Prof. Mats Bohgard, Rose-Marie Akselsson, Karin Öhrvik, Susanne Nordbeck and Lena Leveen for helping me with administration tasks, Eileen Deaner for polishing articles and proofing this thesis, and, Robert Olsson for solving computer and internet problems. Many thanks also go to the service group for your nice and wonderful service. Lotta Malmborg at LTH Kansli, for helping me with many administrative tasks. Meibao Ge at Zhejiang Sci-Tech University, for exchanging ideas and solving mathematic and Matlab problems; Pengjun Xu and Xianfu Wan from Donghua University, for your friendship and generous help; Yifan Zhang from the Hong Kong xii
18 Polytechnic University, for helping me in searching reference papers; Huilong Wang from the School of Industry Design at Lund University, for drawing a nice thesis picture. My family members, for your endless trust, care and love. Particularly, to my wife, Lili, thank you for your unfailing support, encouragement, love and generous sacrifice; for accompanying me in the past three years in Sweden. I understand that it has been a really tough life in Sweden since you did not get a fulltime job. To my parents, parents-in-law and other family members, thanks for always standing by us. Mr. Tore, our senior dry heated thermal manikin (Oh, no! He is now a guy that can sweat as well), for your wonderful cooperation and great contribution to this thesis. Finally, the Chinese Scholarship Council and the Taiga AB company (http: in Varberg, are gratefully acknowledged for their financial support. Faming Wang Sept Hässleholm xiii
19 xiv
20 Nomenclature Symbol Meaning SI units A surface area m 2 A D DuBios body surface area m 2 A du body surface area m 2 A i surface area of the segment, i m 2 A r body surface area participating in radiant heat exchange m 2 a coefficient for Eq. (4-3) - B coefficient for Eq. (1-11) - b coefficient for Eq. (1-11) - C convective heat transfer W/m 2 C b specific heat of the human body W h/( C kg) Corr correction factor for localised resultant evaporative - resistance c coefficient for Eq. (4-3) - d coefficient for Eq. (4-3) - d mean thickness of discs of the hot plate m E evaporative heat exchange W/m 2 E dif evaporative heat loss through moisture diffusion W/m 2 E res respiratory heat exchange W/m 2 E rsw evaporative heat loss through sweating W/m 2 E sk evaporation from skin surface W/m 2 e coefficient for Eq. (4-3) - f cl clothing area factor - H b body height m H d total dry heat loss W/m 2 H dry total dry heat transfer W H e evaporative heat loss W/m 2 H e,env evaporative heat taken from the air in a so called isothermal W xv
21 H e,heat condition observed evaporative heat loss from the sweating thermal W/m 2 manikin in a so called isothermal condition H e,i segmental evaporative heat loss of the segment, i W/m 2 H e,mass evaporative heat loss calculated from the observed mass W/m 2 loss rate in a so called isothermal condition HL total observed heat loss from the sweating thermal manikin W/m 2 h c convective heat transfer coefficient W/(m 2 C) h e evaporative heat transfer coefficient W/(kPa m 2 ) h fg latent heat of water evaporation W h/g h r radiant heat transfer coefficient W/(m 2 C) I T clothing total thermal insulation K m 2 /W i segment number of the sweating thermal manikin - K conductive heat transfer W/m 2 LR Lewis relation K/kPa M body metabolism W M sk net metabolic heat W m clothing weight kg m mass loss kg body weight change per unit area kg/h m i mass loss at the segment, i kg p probability - p a partial water vapour pressure in the air kpa p s saturated water vapour pressure kpa p sk water vapour pressure on skin surface kpa p sk,i water vapour pressure on skin surface at the segment, i kpa q heating power W R radiant heat transfer W/m 2 R a boundary air layer s thermal resistance K m 2 /W xvi
22 R cl clothing/fabric intrinsic thermal resistance K m 2 /W R ct fabric total thermal resistance K m 2 /W R ea boundary air layer s evaporative resistance kpa m 2 /W R ecl clothing intrinsic evaporative resistance kpa m 2 /W R et clothing total evaporative resistance kpa m 2 /W R et_heat clothing total evaporative resistance calculated by the heat loss method (ASTM F2370 [2010]) kpa m 2 /W R et,i clothing total evaporative resistance of the segment, i kpa m 2 /W R eti,r clothing total resultant evaporative resistance at the segment, i R eti,ref clothing total evaporative resistance of the segment, i, R et_mass R et_p1 R et_p2 determined at reference condition clothing total evaporative resistance calculated by the mass loss method (ASTM F2370 [2010]) clothing total evaporative resistance calculated from predicted wet fabric skin temperature by Eq. (4-1) clothing total evaporative resistance calculated from predicted wet fabric skin temperature by Eq. (4-2) kpa m 2 /W kpa m 2 /W kpa m 2 /W kpa m 2 /W kpa m 2 /W R etr clothing total resultant evaporative resistance kpa m 2 /W RH relative humidity % RH a relative humidity in the air % RH sk relative humidity on skin surface % S body heat storage rate J/m 2 T a air temperature C T b mean body temperature C T manikin thermal manikin surface temperature C T r radiant temperature C Tre rectal temperature C Tre_p predicted rectal temperature by the PHS model C xvii
23 T s temperature of the plate surface of the hot plate C Tsk human skin surface temperature C T sk,f fabric skin surface temperature C Tsk_p predicted human skin temperature by the PHS model C T skf_p1 predicted fabric skin temperature by Eq. (4-1) C T skf_p2 predicted fabric skin temperature by Eq. (4-2) C T 1 temperature of the plate 1of the hot plate C T 2 temperature of the plate 2 of the hot plate C t time h t cl clothing surface temperature C t mean radiant temperature C r v a air velocity m/s W external work rate W W b body weight kg W f fabric weight g/m 2 w walking speed m/s w s skin wettedness - Greek letters Symbol Meaning SI units λ heat of vapourisation of water J/g λ i heat of vapourisation of water at the segment, i J/g λ T thermal conductivity W/(m K) σ Stefan-Boltzman constant W/(m 2 K 4 ) Subscripts dif heat mass ref diffusion heat loss method mass loss method reference condition xviii
24 Table of contents Popular science summary... i Abstract... iii List of publications and author s contribution... v Additional papers, not included in the thesis... vii Acknowledgements... xi Nomenclature... xv 1.Literature review Brief introduction Protective clothing Clothing thermal comfort evaluation Hot plate Skin simulator Thermal manikin Human heat balance equation Convective heat transfer Radiative heat transfer Evaporative heat transfer Heat stress and development of body heat strain Heat stress assessment and heat strain prediction Objectives Methods Experimental design Clothing ensembles Experimental protocols Physiological measurement parameters Calculations xi
25 3.6 Data analyses Results and discussion Effect of temperature difference between T manikin and T sk,f on evaporative resistance (Paper I) Boundary air layer s evaporative resistance Clothing total evaporative resistance Development of a universal empirical equation for wet skin temperature prediction (Paper II) Determination of evaporative heat taken from the ambient: selection of calculation options (Paper III) Localised boundary air layer and clothing evaporative resistance for local body segments (Paper IV) Individual effects on localised boundary air layer s evaporative resistance Combined effect on localised boundary air layer s evaporative resistance Combined effect on localised clothing evaporative resistance Application of clothing evaporative resistance in the PHS model (Papers V and VI) Comparison of predicted and observed physiological data Suggestions on further revision of the PHS model Extended discussion Conclusions Future study References Appendix I: Glossary of terms xii
26 1. Literature review 1.1 Brief introduction Clothing is the second skin of human beings (Horn and Gurel 1981) and it serves several functions: adornment, status, modesty and protection (Li and Wong 2006). By wearing fashionable and aesthetic garments with proper adornments, one can reach his or her mental comfort. In some societies, clothing reflects the wearer s social rank or status. In ancient Rome, for example, only senators were allowed to wear clothing dyed with Tyrian purple (Reinhold 1971). Regarding the protective function, clothing plays two primary roles (Li and Wong 2006): helping the human body maintain body core temperature; and protecting the body from injury from abrasion, scratches, fire, radiations, chemical toxic substances, electricity and insect bites. Goldman summarised four primary factors in clothing comfort, and identified as the 4Fs of comfort : fashion, feel, fit and function (Goldman 2005). Definitely, clothing plays an important role between the human body and its surrounding environments in determining subjective and objective perceptions of comfort. In order to understand the mechanisms behind these perceptions, the interaction among the human body, clothing and the environment should be clearly investigated (Goldman and Kampmann 2007). 1.2 Protective clothing Protective garments are designed to prevent harmful exposures to various hazards in the environment. These include fire, extreme heat and cold, water, chemicals, particulates, blood-borne pathogens, biological agents, electrical power, radioactive materials, physical force or impact (e.g., bullets, bomb fragments, sports and work equipment, falling debris), and ultraviolet light. The protection must be sufficient but allow performing tasks; otherwise, it may put the wearer in a dangerous condition. Generally, the protective function of a protective garments 1
27 is highlighted as oppose to other aspects such as fashion. That is why protective clothing is usually made with specialised materials, innovative finishing, and unique designs (Li and Wong 2006; Holmér 2006). The performance of a protective clothing system depends mainly on the textile structure, clothing moisture permeability, fibre wicking, absorption and desorption properties as well as on the course of heat and mass transfer processes within clothing (Yarborough and Nelson 2005; Li and Wong 2006). For a well-designed protective garment, the gains in a high level of protection should not be compromised by increased physiological or mental strain, reduced performance or other negative factors such as increased discomfort (Holmér 2006). The design of protective clothing systems should consider such ergonomic requirements as not constricting body movement and not being too heavy (Huck 1988; Havenith and Heus 2004). 1.3 Clothing thermal comfort evaluation Umbach (1983) suggested that clothing performance could be adequately predicted based on physiological measurements and subjective data. Such data may be obtained from either climatic chamber tests or field studies. Human subject tests, however, are time and labour intensive; cost and ethical issues may be involved. Instead measurements of clothing thermal comfort have been carried out on objective apparatuses, such as hot plates, skin simulators and thermal manikins (Kenney et al. 1987; Holmér and Nilsson 1995). With regard to clothing thermal comfort, thermal insulation (or thermal resistance) and evaporative resistance (or moisture vapour resistance) are the two most important physical parameters (Holmér 1995; Fan and Chen 2002; Qian and Fan 2006; Wu and Fan 2009; Yu et al. 2011). Thus, determination of these two physical factors is the main focus for objective assessments of clothing thermal comfort. Many objective evaluation apparatuses have been developed over the past 30 years. Hot plates, simple skin simulators and thermal manikins are the most innovative instruments (Bankvall 2
28 1973; Gibson et al. 1994; Mattle 2000; Meinander 2000; Richards and Mattle 2001; Fan and Qian 2004; Psikuta et al. 2008a, b) Hot plate The hot plate was first developed by Lee in England in 1898 (Brown 2006). At that time, it was an unguarded hot plate: a pair of thin circular discs was clamped between three copper plates. The heat was electrically generated in the central plate and conducted in the axial direction through the discs to the outer two plates. The temperature of the discs was assumed equal to the temperature of the plates. The temperature was measured using thermocouples. The thermal conductivity λ T could be computed by (Salmon 2001) qd T 2 A( T T ) 1 2 Eq.(1-1) where, q is the supplied heating power, W; T 1 -T 2 is the mean temperature difference between the plates, C; d is the mean thickness of the discs, mm; A is the cross-sectional area of the plates, m 2. The sweating guarded hot plate, also referred to as the skin model, is able to simulate both heat and moisture transfer from skin surface through a piece of cloth to the ambient environment. A schematic drawing of a typical sweating guarded hot plate is displayed in Fig.1.1. Fig.1.1 Schematic drawing of sweating guarded hot plate. 3
29 Generally, the sweating guarded hot plate consists of three main units (McCullough et al. 2003; Huang 2006): a measuring unit, a temperature controlling unit and a water supply unit. The measuring unit is fixed to a metal block embedded with heating elements. The plate test section is surrounded by a guard section. The guard heaters are applied to eliminate lateral heat flow to/from the main heater. The bottom heater serves the function of preventing downward heat loss from the test section and guard heaters. Such a design forces both the heat and moisture transfer upward only, (i.e., they transfer perpendicularly to the test specimen s surface). The test specimen is placed on the heated porous plate, which is normally heated to a constant temperature to represent the normal human skin temperature (e.g., 35.0 C). Temperature sensors detect the temperature of the plate. The heating power is recorded throughout the measurement. For the evaporative resistance measurement, distilled water is fed to the heated porous plate from a dosing unit. This unit is activated when the water level in the plate is 1 mm below the plate s surface. Water was preheated when flowing through the guard heater zone. A piece of waterproof but permeable membrane is placed on the plate. Air bubbles and wrinkles may exist under this piece of membrane, thus, cautions has to be used to ensure that such bubbles and winkles are totally removed. The test specimen is directly placed above the membrane. Under the steady-state, the fabric s total thermal resistance R ct and evaporative resistance R et can be calculated by Eq.(1-2) and Eq.(1-3), respectively. R ct A( Ts Ta) Eq.(1-2) H d A( ps pa) Ret Eq.(1-3) H e 4
30 where, A is the surface area of the plate test section, m 2 ; T s and T a are the temperatures on the plate surface and in the ambient air, respectively, C; H d and H e are the total dry heat loss and evaporative heat loss, respectively, W; p s and p a are the water vapour pressures at the plate surface and in the ambient air, respectively, kpa. The boundary air layer s thermal resistance R a and evaporative resistance R ea can be determined by conducting tests on the bare plate. The fabric s intrinsic thermal resistance R cl and intrinsic evaporative resistance R ecl can be determined by Eq.(1-4) and Eq.(1-5), respectively. Rcl Rct Ra Eq.(1-4) Recl Ret Rea Eq.(1-5) It should be pointed out that the aforementioned guarded hot plate is a flat apparatus. It cannot provide information critical to clothing design and cannot detect the effects of clothing fit, joining, seaming and pumping effects from body movement and articulation (Song 2011). Also, such measurements do not account for the effects of air volume inside the clothing. Thus, those fabric measurements provided limited information Skin simulator A skin simulator (i.e., sweating torso) has a cylindrical shape that is similar to the human trunk (Camenzind et al. 2001; Keiser et al. 2008). It is mainly used to study clothing fabrics as well as sleeping bags. A stretchable skin layer fabric is used to mimic the human skin layer. The torso can be run in several modes: constant temperature mode, constant power mode, and physiological control mode (Zimmerli and Weder 1997; Keiser et al. 2008; Psikuta 2009). Take the EMPA s sweating torso (see Fig.1.2) for example, where there were 54 sweating outlets 5

31 spread on the torso to produce sweat. Different human activities can also be simulated by changing predefined phase sequences. The torso surface temperature and weight are recorded during the testing. A single-section torso has solved many of the problems that were left by guarded hot plates: it has the size and shape of the human trunk; it can also mimic different thicknesses of homogeneous air gaps between adjacent cloth layers (Kim et al. 2003). Nevertheless, it cannot simulate human movement. Such simulators are unable to mimic realistic microclimate air gaps inside a clothing system. Hence, sweating torso measurements disregard the non-uniform heat and moisture transfer (Frackiewicz-Kaczmarek et al. 2011). To study the effects of different body diameters and movements as well as non-homogeneous air gaps on localised heat and moisture transfer through clothing ensembles, a multi-segment sweating and moveable thermal manikin is required. Fig.1.2 Sweating torso at EMPA, Switzerland ( Keiser 2007) Thermal manikin Thermal manikins are essential tools to evaluate clothing comfort, automobile environments as well as to assess the effect of heating, ventilation and air conditioning (HVAC) systems on humans. The thermal manikin measurement 6
32 meets basic thermo-physiological requirements of whole body exchange. It can detect clothing layer and dynamic movement effects, clothing drape, fit, and body covering area. Therefore, measurements performed on a full-size thermal manikin are realistic, fast, accurate, reproducible, cost-effective and provide baseline values for standards and models (Holmér and Nilsson 1995). More than 100 thermal manikins are in service worldwide (Holmér 2004). The number is expanding every year. The development of heated thermal manikins started in 1945 (Zimmerli 2000), when the US Army Research Institute of Environmental Medicine (also known as USARIEM ) built a manually controlled, one-section copper thermal manikin. Afterwards, researchers from England, France, Denmark, Sweden, Finland, Germany and the Kansas State University (KSU) headed the development, and advanced computer controlled, multi-segment and moveable manikins were built (Wyon 1989; Holmér 2004). In 1989, the first female plastic manikin was developed by the Danish researchers (Madsen 1989). The first continuous sweating thermal manikin, Coppelius, was developed at the VTT Technical Research Centre of Finland in a Scandinavian project concerned with thermal comfort (Meinander 1992, 1997). Coppelius has a total of 18 segments and 187 sweating glands. It does not sweat at the head, hands and feet. An inner nonwoven material is applied to help water distribution. The outer membrane layer is used to prevent water drip and to hold excessive water. Almost 10 years later, in 2001, the Swiss multi-segmental sweating agile thermal manikin SAM was developed (Richards and Mattle 2001). SAM has a total of 30 body segments and 125 sweat outlets. This manikin can simulate both vapourous and liquid sweating over the whole body and over any local body segment, with variable sweating rates from 0 to 4 l/(m 2 h). In addition, SAM has moveable joints, which allows it to perform even complicated 2D movements of each limb. It can reach a walking speed of 3.0 km/h. 7

33 In 2002, an inexpensively priced, one-segment sweating fabric thermal manikin, Walter, was developed in Hong Kong (Fan and Chen 2002). This manikin has a waterproof but water vapour permeable Gore-Tex skin. It can only simulate gaseous perspiration. Walter can determine clothing thermal insulation and evaporative resistance in one step. Moreover, it is the first manikin that has consistency in sweating over the entire body. Although Walter addressed many problems of other sweating manikins, it did not provide a method for determining localised thermal comfort properties, nor did it mimic liquid sweating. In addition, the use of a Gore-Tex fabric skin layer may change the driving force for water evaporation due to the low permeability of the Gore-Tex skin. Fig.1.3 Sweating thermal manikin at INAIL, Italy (Newton, MTNW, Seattle, WA) Because current sweating thermal manikins are unable to simulate the transient thermal responses of humans, the recent development of thermophysiological model controlled multi-segment sweating thermal manikins has become a main trend (Richards et al. 2006; Psikuta et al. 2008a,b; Burke et al. 2010; Blood and Burke 2010; Redortier and Voelcker 2010, 2011). At present, commercial physiological controlled Newton sweating thermal manikins (see Fig.1.3) are available from MTNW (Measurement Technology Northwest) Inc. (2011). Nevertheless, the reported results obtained on such physiological model controlled 8
34 thermal manikins have shown large discrepancies in human subject data. Some possible reasons accounting for these large differences are the incorrect system operation over the application range and manikin configuration issues such as the use of thick fabric skin (Redortier and Voelcker 2011). 1.4 Human heat balance equation To investigate heat exchange from the human body to its surrounding environment, the heat balance equation (Gagge and Gonzalez 1996) is an essential guideline. It may be written as S M W ( R C K) E Eq.(1-6) where, S is the body heat storage rate; M is the body metabolism; W is the work rate (+ for work against external forces); R is the radiant heat exchange (+ for a gain); C is the convective heat transfer (+ for a gain); K is the conductive heat transfer (+ for a gain); E is the evaporative heat transfer (- for a loss). as The equation of heat exchange at the human skin surface can also be simplified S M sk Hdry Esk Eq.(1-7) where, M sk is the net metabolic heat; H dry is the total dry heat transfer from skin surface through radiation, convection and conduction; E sk is the evaporation from skin surface (- for a loss). The units of all the above rate of energy gains or losses are energy per second; J/s or watt (W). In fact, the rate of energy change per unit time and per body surface area is used more often (Holmér 2004): W s/m 2. The human body surface area is usually determined by the DuBois and DuBois equation (1916) A W H Eq.(1-8) D b b 9
35 where, A D is the DuBois body surface area, m 2 ; W b is the body weight, kg; H b is the body height, m. For a body to be in heat balance, the body heat storage S should be equal to zero. If S>0, the body temperature will rise. On the contrary, if S<0, the heat storage will be negative and the body temperature will drop. The rate of body heat storage is directly associated with the mean body temperature change, which can be expressed as Wb Tb S ( Cb ) Eq.(1-9) A t D where, C b is the specific heat of the body, C b =0.965 W h/ ( C kg); T / t is the mean body temperature change rate per unit time, C/h Convective heat transfer The convective heat transfer C between a clothed body and the environment may be written as C h f ( t t ) Eq.(1-10) c cl cl a where, h c is the convective heat transfer coefficient, W/(m 2 C); f cl is the clothing area factor (dimensionless), which may be determined by body segment circumference measurement, by photograph technology or by a 3D body scanner (Anttonen et al. 2004; McCullough et al. 2005; Gao et al. 2005; Apeagyei 2010); t cl and t a are the mean clothing surface temperature and the mean air temperature, respectively, C. The convective heat transfer coefficient h c varies with air velocity and walking speed due to convection is caused by air and body movements. Many researchers have defined the convective heat transfer coefficient (see Table1.1) through either b 10
36 human tests or thermal manikin measurements, a universal expression for the convective heat transfer coefficient may be read as h c B v Eq.(1-11) b a where, B and b are coefficients; v a is the air velocity, m/s. Table 1.1 Empirical equations for estimating convective heat transfer coefficient. Equation Range of v a Condition Reference 0.5 h c =12.1v a semi-reclining Winslow et al. (1939) 0.5 h c =8.16 v a nude, standing Nelson et al. (1947) 0.7 h c = v a nude, reclining Colin et al. (1967) 0.6 h c =7.25 v a nude, sitting Mitchell et al. (1969) 0.5 h c =8.6 v a clothed, walking Nishi et al. (1970) 0.4 h c =12.2 v a seated manikin Ichihara et al. (1997) 0.43 h c =10.1 v a standing manikin Mochida et al. (1998) 0.9 h c = v a standing manikin Kuwabara et al. (2005) Radiative heat transfer The radiative heat exchange R between a clothed body and its exposed environment is generally calculated by R h f ( t t ) Eq.(1-12) r cl cl r where, h r is the radiative heat transfer coefficient, a typical value at room temperature is 4.5 W/(m 2 C); t r is the mean radiant temperature, C. The radiative heat transfer coefficient is computed by Eq.(1-13) h r tcl tr Ar A 3 du Eq.(1-13) where, σ is the Stefan-Boltzman constant, v= W/(m 2 K 4 ); ε is the emissivity of the clothed body surface (dimensionless). The emissivity is normally close to unity (about 0.95), unless reflective materials are used or high-temperature 11
37 sources are applied (ASHRAE 1997). A r /A du is the effective surface area participating in the radiative heat exchange (dimensionless). The ratio A r /A du equals 0.70 for a sitting person and 0.73 for a standing person (Fanger 1967) Evaporative heat transfer The total evaporative heat loss E (latent heat) can be determined by both direct calorimetry and partitional calorimetry (Holmér and Elnäs 1981; Gagge and Gonzalez 1996). E may be given by h E E E m A fg sk res Eq.(1-14) D where, E sk and E res are the evaporative heat loss of sweat from skin and respiratory evaporative heat loss, respectively, W/m 2 ; is the body weight change per unit time, g/h; h fg is the latent heat of sweat evaporation (h fg =40.8 W h/g [Snellen et al. 1970]). It should be noted that Eq.(1-14) is only valid on humans during light or moderate exercise. For humans during heavy exercise, a correction should be made for the change rate of CO 2 loss over O 2 gain (Gagge and Gonzalez 1996). Under steady-state, the evaporative heat exchange E sk of sweat from skin to the environment can be expressed as (Holmér 1995; ASHRAE 1997; Parsons 2003) ws ( psk pa ) ws ( psk pa ) Esk Ersw Edif R 1 et ( Recl ) f h cl e Eq.(1-15) where, E rsw and E dif are the evaporative heat losses from the skin through sweating and through moisture diffusion, respectively, W/m 2 ; w s is the skin wettedness factor (dimensionless); p sk and p a are the water vapour pressures on the skin surface and in the air, respectively, kpa; R et is the clothing total evaporative 12
38 resistance, kpa m 2 /W; R ecl is the clothing intrinsic evaporative resistance, kpa m 2 /W; h e is the evaporative heat transfer coefficient, W/(m 2 kpa), it can be derived from the Lewis Relation h LR h Eq.(1-16) e c where, LR=16.5 K/kPa at standard environment (25 C, RH=50%, at the sea level). 1.5 Heat stress and development of body heat strain Heat stress is the net heat load to which a person may be exposed from combined factors such as metabolic rate, air temperature, relative humidity, air velocity, radiation and such clothing factors as thermal insulation and evaporative resistance (Beshir et al. 1981; ACGIH 2001). A mild or moderate heat stress may cause discomfort and a deterioration of performance (Azer et al. 1972; McMorris et al. 2006). If the heat stress level reaches human tolerance limits, heat-related illnesses such as heat syncope, heat cramp, heat exhaustion and heat stroke may occur (Knochel 1989; Parsons 2003). Generally, sweating occurs after a core temperature increase of about 0.2 to 0.3 C from a baseline body core temperature of 37.0±0.5 C (Gagge and Gonzalez 1996). With continued body heat storage, an increase of sweat production occurs in proportion to core temperature change rate. Dripping of sweat takes place as sweating becomes more and more profuse. Unfortunately, dripping sweat makes no contribution to cooling the body. If the sweat is absorbed by the clothing and transported to the clothing s outer surface, the cooling power of produced sweat will be reduced (Havenith et al. 2009). On the other hand, protective clothing ensembles are used to eliminate or reduce the effects of environmental stress factors such as heat, cold and contamination (Holmér 2006). They are often impermeable to water vapour. Therefore, sweat evaporation is largely constricted by such clothing. This adds extra heat stress to the wearers. Combined with the largely restricted sweat evaporation caused by the protective 13
39 clothing, an accelerated rise in body core temperature will probably occur. The probability of heat exhaustion when the core temperature reaches C becomes very high (Glazer 2005). Classic heat stroke occurs when the core temperature is beyond C (LoVecchio et al. 2007). Finally, the degradation of body protein will appear when the core temperature exceeds C (Jay and Kenny 2010). 1.6 Heat stress assessment and heat strain prediction The heat stress evaluation may be performed by measuring physical thermal environment parameters and following the evaluation of their impacts on the human body by using a single index or more. Many attempts have been made to assess/predict physiological heat strain and to combine various heat stress parameters into an empirical index, such as the wet-bulb globe temperature (WBGT) index (ISO7243 [1994]). Givoni and Goldman (1972) developed a model for prediction of core body temperature response and found that a theoretical equilibrium core body temperature matches the skin temperature at any given combinations of the environment, metabolism and clothing ensemble. The USARIEM developed a heat strain model (Cadarette et al. 1999) that has now been incorporated into a heat strain decision aid (Xu and Santee 2011). This empirical model predicts core temperature, maximum work times, sustainable work/rest cycles, water requirements and heat casualties. Many rational models (Brake and Bates 2002) have been also developed for predicting heat strain in the past 60 years, such as the heat strain index (HSI), the index of thermal stress (ITS) and the required sweat rate index SWreq (ISO79338 [1989]). A rational model called Predicted Heat Strain (PHS) model was developed in the BIOMED project (Malchaire et al. 2001). It was derived from an in-depth revision of the previous required sweat rate index (Malchaire et al. 2000). In this model, new algorithms were created based on scientific literature concerning, convection, evaporative heat transfer, rectal and skin temperatures. 14
40 This model was developed based on the human heat balance equation, which made the predicted physiological parameters consistent with heat transfer theory. This rational model was later adopted by the ISO standard (ISO7933 [2004]) and has been used as a tool to predict the human thermophysiological responses of a standard person exposed to hot environments. Many advanced human thermoregulatory models have been developed in the past three decades. These models are rather complicated and most of them were derived from previous fundamental research carried out by Stolwijk and Hardy (1977). They have become valuable tools for researchers to understand thermal regulation processes. Unfortunately, they have yet to gain widespread applications yet. Currently, the most influential and popular thermoregulatory models are Wissler model, Xu and Werner model, Fiala Model and Tanabe model (Wissler 1985; Werner 1989; Xu and Werner 1997; Fiala et al. 1999; Tanabe et al. 2002). 15
41 16
42 2. Objectives The previous round robin study on the determination of clothing evaporative resistance using sweating thermal manikins (McCullough 2001; Richards and McCullough 2005) showed great variations of %. The large discrepancy was mainly due to variations in the measurement techniques, test conditions and sweating system constructions of the manikins. Different calculation methods (Havenith et al. 2008b; Wang, Gao, Kuklane and Holmér 2011) may also have contributed to those great variations. In order to contribute to enhancing the measurement repeatability as well as its reproducibility, the research presented in this thesis has examined several main issues that cause large errors in clothing evaporative resistance. Further, because total evaporative resistance provides very limited information for the local body areas, localised evaporative resistance was also investigated through an inter-laboratory study. Finally, an example application of using clothing evaporative resistance for predicting body heat strain was demonstrated. A validation of the predicted heat strain (PHS) model was also performed. The main objectives of the research presented were a) To examine the errors in using manikin surface temperature instead of wet fabric skin temperature to calculate the evaporative resistances of the boundary air layer and clothing. b) To measure the wet fabric skin surface temperature by applying additional temperature sensors and to develop a universal empirical skin temperature prediction equation for the sweating thermal manikin Tore. c) To study how to choose from two calculation options of clothing evaporative resistance for measurements conducted in a so-called isothermal condition (T manikin =T a =T r ). 17
43 d) To determine the amount of heat taken from the surrounding environment for the wet fabric skin evaporation in a so-called isothermal condition (T manikin =T a =T r ) by performing manikin experiments. e) To investigate the combined effects of air and body movements on localised clothing evaporative resistance and to develop empirical equations for local body segments. f) To demonstrate the application of evaporative resistance in a heat strain model and to check thermophysiological responses of human subjects wearing different protective clothing in various moderate warm and hot environments. g) To validate the Predicted Heat Strain (PHS) model (ISO 7933) and to point out potential improvements in order to gain better applicability in the relevant scientific research field and in the practical work situations. 18
44 3. Methods 3.1 Experimental design The experimental conditions of all studies included in Papers I-VI are displayed in Table 3.1. For all manikin measurements, the experimental conditions were selected to ensure that both the thermal manikin and the climatic chamber were well regulated throughout all the experimental periods. For human trials, the experimental conditions were selected mainly based on both operation range of the predicted heat strain (PHS) model (ISO 7933) and capacity of the climatic chamber. Table 3.1 Experimental conditions selected in Papers I-VI. T a RH a % p a kpa v a m/s C Study 1 (Paper I) ± ± ± ± Study 2(Paper II)-equation development part ± ± ± Study 2(Paper II)-equation validation part ± w m/s 19
45 ± ± Study 3(Paper III) ± Study 4(Paper IV)- boundary air layer study (local) ± ± ± Study 4(Paper IV)-clothing study (local) ± ± ± Study 5 (Paper V)-human trials (hot environments) ± Study 6 (Paper VI)-human trials (warm environments) ± Notes: T a, air temperature; RH a, relative humidity in the air; p a, air water vapour pressure; v a, air velocity; w, walking speed. A Tore thermal manikin was used in Papers I-III, while in Paper IV, Newton type thermal manikins were used for experiments. The manikin surface temperature of all studies was controlled at 34.0 C except for some of the experiments used in Paper III (some were performed without heating power). All tests were repeated at least twice for each test scenario. The first study (Paper I) was designed to examine the temperature difference between controlled manikin surface temperature and uncontrolled wet fabric skin surface temperature. The experimental conditions were selected to demonstrate that this temperature difference is determined by evaporation rate. The higher the evaporation rate from the wet fabric skin, the larger the temperature difference. On the other hand, the evaporation rate is mainly determined by the water vapour pressure gradient between skin surface and environment, and air velocity. It can be 20
46 seen from Table 3.1 that the selected ambient water vapour pressure ranges from 1.20 to 3.83 kpa. In study 2 (Paper II), a universal equation for wet skin temperature prediction was developed. All skin experiments were conducted at a temperature range of C. Different levels of relative humidity (RH) were selected at each temperature level. In the validation experiments, additional clothing ensembles were dressed on the manikin. The measured wet fabric skin temperature and predicted wet skin temperature were compared. A so-called isothermal condition (T manikin =T a =T r =34.0 C) was chosen for experiments in study 3 (Paper III). The air velocity was kept at a constant value: 0.33±0.10 m/s. In order to determine the amount of heat taken from the environment by the wet fabric skin, the manikin was disconnected from its power source (i.e., unheated). Other experiments were performed with a constant temperature mode (i.e., T manikin =34.0 C). Because a clothing total evaporative resistance value provides very limited information for clothing local body segments, in study 4 (Paper IV), the experimental conditions were selected to examine the effects of walking and air speed on localised evaporative resistance. Three levels of air speed and three levels of walking speed were used in both the boundary air layer study and clothing study. Because all experiments were conducted randomly at three different laboratories, the air velocity levels for the boundary air layer study were not exactly the same as those for the clothing study. In studies 5 and 6 (Papers V and VI), three levels of air temperature were chosen: 20.0, 30.0 and 40.0 C, representing different heat stress levels. The water vapour pressure inside the chamber was intended to be kept at either 2.0 or 3.0 kpa. However, the observed values varied with external weather conditions and subject sweating levels. 21
47 3.2 Clothing ensembles Various vocational clothing ensembles were used in the series of studies. The characteristics of all clothing ensembles are described in Table 3.2. Table 3.2 Clothing ensembles used in Papers I-VI. Testing code Garment Component I t C m 2 /W R et * kpa m 2 /W m kg SKIN cotton fabric skin, knitted L t-shirt, briefs, short pants, socks, sports shoes HV t-shirt, briefs, long trousers with 3M reflective materials, socks, sports shoes MIL jacket, long trousers, net t-shirt, briefs, socks, sports shoes CLM polyamide overall laminated with Gore-Tex membrane, t-shirt, briefs, socks, sports shoes PERM permeable overall (hydrophobic layer laminated with inner PTFE membrane) IMP impermeable overall (PA webbing coated with PVC) FIRE RB90 firefighting clothes, underwear, t-shirt, briefs, socks, sports shoes Notes: I t, total thermal resistance; R et, total evaporative resistance; m, clothing total weight.*the evaporative resistance values presented in the table were calculated based on the mass loss option. 3.3 Experimental protocols All thermal manikin wet experiments were performed in controlled climatic chambers. The ASTM F2370 (2010) standard was selected as the main guideline. In order to simulate sweating, a pre-wetted fabric skin was dressed on the dry heated manikin Tore. There was no covering on the head, hands and feet. This method was not a continued sweating setup; the fabric skin would then dry out in less than 50 minutes. Nevertheless, it functions well and is easy to perform. Prior to performing studies 1 and 2, there were two main plausible options for attaching the temperature sensors to determine wet fabric skin temperature: either on the manikin surface to measure the wet fabric skin inner temperature or on the wet fabric skin surface to acquire the skin outer surface temperature (see Fig.3.1). 22
![Fig.3.1 Sensor attachments applied in the study. [Reprinted with permissions] The first option was easy to perform, and each sensor had a standard fixed position.](/docs-images/80/81973559/images/48-0.jpg "Since temperature sensors were fixed on the manikin surface, there was no need to attach them again when taking off the fabric skin for another cycle of rinse.")
48 Fig.3.1 Sensor attachments applied in the study. [Reprinted with permissions] The first option was easy to perform, and each sensor had a standard fixed position. Since temperature sensors were fixed on the manikin surface, there was no need to attach them again when taking off the fabric skin for another cycle of rinse. The second option was quite time-consuming, and all sensors had to be removed and attached again for each new experiment. In this matter a comparison of the wet skin inner temperature and the outer surface temperature was made. The statistical analyses indicated that there were no significant differences between skin inner and outer temperatures (Wang, Kuklane, Gao, Holmér and Havenith, 2010). Therefore, in studies 1 and 2, twelve temperature sensors (Sensirion SHT75, Sensirion AG, Switzerland) were attached to the manikin surface to measure wet fabric skin inner surface temperature. In studies 3 and 4, the wet fabric skin outer surface temperatures were determined by attaching sensors to the wet fabric outer surface using thread rings. In study 4, thermocouples (tip diameter: 0.5 mm, copper-constantan) with a data logger (Testo 177 T4, Testo AG, Germany) were used for skin temperature acquisition. All physiological testing followed the following protocol: each separate garment, equipment, and subject were weighed on a weighing scale during preparation (Mettler-Toledo Inc., Switzerland, precision: ±2 g). Afterwards, subjects came into the chamber and walked on a treadmill (Exercise X Track Elite, Norway) at a speed of 4.5 km/h. The subjects were weighed again after 30 23
49 min of exposure to collect the first 30 min sweat rate (normally the sweating reached steady state after 30 min). The heart rate, the rectal (T re ) and skin (T sk ) temperatures were recorded throughout the trials. Test sessions were terminated when one of the following four criteria was reached: (a) subjects felt the conditions were intolerable and were unable to continue, (b) the rectal temperature T re reached 38.5 C, (c) test leaders decided to stop the test, or d) subjects completed 70 min exposure. Once the test session was finished, the subject was weighed again. They took off equipment and garments. Each garment was weighed separately after the subject removed them. Right after the subjects were undressed and the measuring equipment was removed, they were weighed wearing just briefs and the rectal sensor to get post-exercise nude body weight. 3.4 Physiological measurement parameters The body core temperature (i.e., rectal temperature) was measured using a rectal temperature probe (YSI 401, Yellow Spring Instrument, Measurement Specialties Inc., USA, accuracy ±0.1 C) at a depth of 10 cm above the anal sphincter. Four skin temperature thermistors (ACC-001, NTC, temperature matched, Rhopoint Components Ltd., UK, accuracy ±0.2 C) were taped on the left four body sites (chest, upper arm, thigh and calf) of the subject s skin surface to acquire mean skin temperature. The well-established Ramanathan s four-point formula was applied to calculate the mean skin temperature (Ramanathan 1964). The oxygen uptake was continuously measured with a MetaMax I instrument (Cortex Biophysik GmbH, Germany) for 5 minutes from the 10th minute of the exposure until the 15th min. The heart rate was tracked with a pulse monitor (Sport Tester, Polar Electro Oy, Finland) throughout the experiment. 24
50 3.5 Calculations For calculations of saturated water vapour pressure on a fully wet fabric skin surface p sk and partial water vapour pressure in the ambient air p a, the Antoine s equation was applied p sk exp( ) RH T 235 sk, f sk Eq.(3-1) p a exp( ) RH T 235 a a Eq.(3-2) where, T sk,f and T a are the wet fabric skin surface temperature and the ambient temperature, respectively, C; RH sk and RH a are the relative humidities at the wet fabric skin surface and in the ambient, respectively, %. The relative humidity on the saturated wet textile fabric surface RH sk was assumed to be 100%. The clothing evaporative resistance R et (ASTM F2370 [2010]) can be calculated by either the heat loss method (i.e., Eq.(3-3)) or mass loss method (i.e., Eq.(3-4)): ( p p ) A Eq.(3-3) H sk a Ret e R et ( psk pa ) A dm dt Eq.(3-4) where, A is the sweating fabric skin surface area, m 2, in all four studies, A was assumed to be equal to the manikin s skin-covered surface area because the textile fabric skin is quite thin and tight fitting around the manikin body shape; H e is the evaporative heat loss from the manikin, W; is the heat of water vapourisation at 25
51 the measured skin temperature, J/g; the ratio of dm/dt is the evaporation rate of moisture leaving the manikin-clothing system, g/h. The intrinsic evaporative resistance of a clothing ensemble R ecl is defined as R ecl R ea Ret Eq.(3-5) f cl Similarly, the localised clothing evaporative resistance R et,i may be determined by either the heat loss method or mass loss method R et, i ( p p ) A sk, i a i Eq.(3-6) H ei, R et, i ( p p ) A sk, i a i Eq.(3-7) dmi i dt where, p sk,i is the localised water vapour pressure on the wet fabric skin at the segment i, kpa; p a is the water vapour pressure in the air, kpa; H e,i is the localised evaporative heat loss at the segment i, W/m 2, λ i is the heat of vapourisation at the skin temperature at the segment i, J/g; dm i /dt is the mass loss rate at the segment i, g/h. The correction factor Corr for localised resultant evaporative resistance (caused mainly by air and body movement) may be expressed as R eti, r Corr Eq.(3-8) R eti, ref where, R eti,r is the localised resultant evaporative resistance at the segment i, kpa m 2 /W; R eti,,ref is the localised evaporative resistance of the segment i 26
52 determined at reference condition (in studies presented in Paper IV, the reference condition is defined as: v a =0.18±0.05 m/s, w=0 m/s, p a =2.1 kpa), kpa m 2 /W. As shown in Eq.(3-3), Eq.(3-4), Eq.(3-6) and Eq.(3-7), the (local) wet fabric skin temperature should be measured and used when calculating evaporative resistance. Nevertheless, very few reported thermal manikin experiments (Fan and Chen 2002; Meinander 1992; Wang, Kuklane, Gao and Homlér 2010, 2011a) actually measured the fabric skin temperature due to the complexity of applying additional sensors to determine fabric skin temperature. Therefore, the prevailing method uses the manikin temperature instead of the wet fabric skin temperature to calculate clothing evaporative resistance. For studies presented in Papers I and II, both methods (the prevailing method and the real method [i.e., the wet fabric skin temperature was used for calculations]) were used and compared. While in other studies presented in Papers III and IV, only the real method was applied for calculations. 3.6 Data analyses In Paper I, the repeated measures ANOVA (Analysis of Variance) was performed for within-subject comparison of the effect of temperature differences (T manikin vs. T sk,f ) on the measured boundary air layer s evaporative resistance. This was achieved using the SPSS version 16.0 (SPSS, Chicago, IL). In Paper II, RMSD (root mean square deviation) was used to examine the prediction of the developed universal skin temperature equation. Multiple nonlinear regression analysis was applied in Paper IV to develop empirical correction equations for the localised resultant evaporative resistance of each segment. Such analyses were performed using the software XLSTAT version 2011 (Addinsoft Inc., Brooklyn, NY). In Paper V, RMSD was applied to examine the prediction acceptance of physiological factors such as core temperature and skin temperature produced by the PHS model. 27
53 For physiological testing (Paper VI), repeated measures ANOVA was also used to determine whether there were significant differences in the metabolism, heart rate, subjective sensations, sweat rate and the evaporative rate for different clothing and thermal environments. The statistical significance was set at p<
54 4. Results and discussion 4.1 Effect of temperature difference between T manikin and T sk,f on evaporative resistance (Paper I) Boundary air layer s evaporative resistance The wet fabric skin temperatures observed were 0.46 to 3.47 C lower than the manikin surface temperatures due to water evaporation (in non-isothermal conditions, the dry heat loss also contributed to these reductions). The temperature difference was dependent on evaporation rate (i.e., water vapour pressure gradient between wet fabric skin surface and ambient air, and air velocity). The real evaporative resistances (i.e., calculated from the wet skin temperature) were lower than the evaporative resistances calculated from the manikin surface temperature (hereafter referred to as prevailing evaporative resistance). The mean real boundary air layer s evaporative resistance was kpa m 2 /W. The average prevailing evaporative resistance was kpa m 2 /W. Statistical results showed a highly significant difference between the real evaporative resistances and prevailing evaporative resistances (p 0.001). Therefore, calculations based on the manikin surface temperature produced errors in the evaporative resistance ranging from 9.9 to 35.9% Clothing total evaporative resistance The temperature difference between T manikin and T sk,f in clothing total evaporative resistance was examined by mathematic deduction. It was found that the prevailing calculation overestimated the real clothing total evaporative resistance by 3.8 to 23.7%. Additionally, the prevailing calculation generated a much larger error on permeable clothing than on semi-permeable/impermeable clothing at the same test condition. This was mainly because a permeable garment usually has a relatively low intrinsic evaporative resistance (it was assumed that the boundary air layer s evaporative resistance and clothing area factor were constant). For 29
55 impermeable clothing such as chemical or CBRN (chemical, biological, radiological, nuclear) protection clothing, the error introduced by the temperature difference might be neglected because such clothing usually has a very high intrinsic evaporative resistance (e.g., R et value could be 0.50 kpa m 2 /W or even higher). The conclusions of Paper I were that the evaporative resistance should be calculated based on the wet fabric skin temperature rather than the manikin surface temperature. In order to determine the real evaporative resistance, the wet skin temperature and climatic conditions should be measured using temperature/rh sensors with good measurement accuracy (e.g., temperature: ±0.1 C; RH: ±2%). Finally, it was concluded that the major errors in calculating the real evaporative resistance of clothing came from the use of the manikin temperature instead of the real wet fabric skin temperature and the control accuracy of the RH value inside the test house. 4.2 Development of a universal empirical equation for wet skin temperature prediction (Paper II) Due to the complexity of measuring wet fabric skin temperature, it was useful to develop a universal empirical equation to predict this temperature. The relationships between wet fabric skin temperature and total heat loss of the manikin are illustrated in Fig.4.1. Considering the fact that the skin surfaces will not cool down if there is no evaporation, a linear regression equation with an intercept (0, T manikin ) was developed accordingly. 30
56 Fig.4.1 The universal empirical equation for wet fabric skin temperature prediction at an ambient temperature range between 25.0 and 34.0 C. [Reprinted with permission] The universal skin temperature prediction equation developed at an environmental temperature range of C is written as Tsk, f HL Eq.(4-1) where, T sk,f is the skin surface temperature, C; HL is the total heat loss observed from the thermal manikin, W/m 2. Havenith (Havenith, Kuklane & Ueno, personal communications, 2007) studied the wet fabric skin temperature on a Newton manikin (Havenith et al. 2008a) by the infrared camera immediately after stripping clothing. The skin temperature prediction equation on their type manikin determined at 34.0 C is read as Tsk HL Eq.(4-2) It should be noted that the universal skin temperature equation (Eq.4-1) was developed based on nude measurements. Therefore, validation experiments with several clothing ensembles were performed. The observed and predicted wet skin temperature data for each test condition were plotted in Fig

![(4-1); T skf_p2, the predicted fabric skin temperature by Eq.(4-2). [Reprinted with permission] The RMSD values have demonstrated that Eq.](/docs-images/80/81973559/images/57-1.jpg "(4-1) has a prediction accuracy of ±0.3 C. In contrast, the prediction accuracy of Eq.(4-2) fell within the ±0.5 C range. Fig.4.3 The clothing evaporative resistances of 6 clothing ensembles calculated based on 4 different temperatures (mass loss method).")
57 Fig.4.2 Observed and predicted fabric skin temperatures for 6 clothing ensembles. T sk,f, the observed fabric skin temperature; T skf_p1, the predicted fabric skin temperature by Eq.(4-1); T skf_p2, the predicted fabric skin temperature by Eq.(4-2). [Reprinted with permission] The RMSD values have demonstrated that Eq.(4-1) has a prediction accuracy of ±0.3 C. In contrast, the prediction accuracy of Eq.(4-2) fell within the ±0.5 C range. Fig.4.3 The clothing evaporative resistances of 6 clothing ensembles calculated based on 4 different temperatures (mass loss method). R et_m, the evaporative resistance calculated 32
58 based on the prevailing method; R et-skf, the calculated evaporative resistance by Eq.(3-4); R et_fp1, the calculated evaporative resistance based on the predicted fabric skin temperature by Eq.(4-1); R et_fp2, the calculated evaporative resistance based on the predicted fabric skin temperature by Eq.(4-2). [Reprinted with permission] The clothing total evaporative resistances of all 6 clothing ensembles calculated using different temperatures (skin temperature, manikin temperature or predicted skin temperature) are presented in Fig.4.3. The calculated clothing evaporative resistances by Eq.(3-4) (i.e., mass loss method, experimental skin temperature was used for calculation) ranged from to kpa m 2 /W. It was evident that the prevailing calculation method (i.e., mass loss method, manikin temperature was used for calculation) produced greater values than the data calculated from Eq.(3-4). On the other hand, the evaporative resistances of all 6 clothing ensembles calculated based on the predicted skin temperatures by Eq.(4-1) and Eq.(4-2) were relatively good. Thus, compared with the prevailing method, the accuracy of clothing evaporative resistance calculation was further enhanced by the empirical equations developed in our study and in Havenith s study (Havenith, Kuklane, and Wang, Personal communications). The conclusion of Paper II was that the accuracy of clothing evaporative resistance was further enhanced by using the predicted wet skin temperature generated from a newly developed universal empirical equation. Nevertheless, it should be pointed out that this empirical equation was developed from the Tore thermal manikin, it is not clear whether it is valid on other sweating thermal manikins. 4.3 Determination of evaporative heat taken from the ambient: selection of calculation options (Paper III) In a so-called isothermal condition (T manikin =T sk,f =T r, Havenith et al. 2008a,b), the evaporative resistances of the boundary air layer and five clothing ensembles 33
59 calculated by two options (i.e., heat loss and mass loss method) are displayed in Fig 4.4. The heat loss method produced greater values than those by the mass loss method. The evaporative resistance values for the boundary air layer and clothing L, HV, MIL, CLM, and FIRE based on the heat loss method were 37.1, , 21.5, 12.7, and 11.2%, respectively, greater than those based on the mass loss option. Fig. 4.4 The evaporative resistances of the boundary air layer and five clothing ensembles calculated by the mass loss method and heat loss method at a so-called isothermal condition (T manikin =T a =T r =34.0 C). [Reprinted with permission] The evaporative heat taken from the environment accounts for % of the total calculated evaporative heat loss. The real evaporative cooling efficiency ranged from to accordingly. Moreover, the theoretical evaporative heat energy taken from the environment (i.e., H e,mass -H e,heat ) was consistent with the observed heat loss H e,env (the differences were 7.4, 8.2, 3.5, -2.0, 0.3 and 0.6 W/m 2 for the nude skin, L, HV, MIL, CLM and FIRE, respectively, which were perhaps mainly caused by measurement error, for example the weighing scale s drift). A second finding was that the higher the thermal insulation of a clothing ensemble dressed on top of the wet textile skin, the less evaporative heat energy 34
60 taken from the environment. This was mainly because high insulation clothing prevented the wet textile skin from absorbing heat energy from the ambient environment. The firelighter s clothing FIRE, for instance, provides a thermal insulation of 2.58 clo, the calculated clothing evaporative resistance by the heat loss method is only 11.2% greater than that based on the mass loss method. In contrast, if there was no clothing dressed on top of the pre-wetted textile skin, the difference between those two evaporative resistance values rose to 37.1%. It was thus concluded that the real evaporative cooling efficiency was higher if a higher insulation garment was used. However, the total amount of evaporation leaving the manikin-clothing system would be greatly impeded by the clothing. Consequently, the real evaporative cooling efficiency was not always necessarily high and the amount of sweat evaporation per unit time leaving the manikin-clothing system was more important. Third, the selection of evaporative resistance calculation options depends on the manikin construction and design. For the Newton type thermal manikin, the heat loss method was widely used. Sweating thermal manikins such as Walter, KEM and Coppelius use the mass loss method. Hence, different calculation options may generate large deviations in evaporative resistance. In order to make these results comparable, a correction of the real evaporative heat loss (i.e., the observed value from the sweating thermal manikin) has to be made. One possible approach to correcting the real evaporative heat loss is to add the amount of heat energy taken from the environment H e,env. An alternative method is to use the real evaporative cooling efficiency to correct the real evaporative heat loss. The conclusion of Paper III was that the determination of clothing evaporative resistance on a thermal manikin should be preferably conducted in a real isothermal condition (T manikin >T sk,f =T a =T r =34.0 C). This can avoid complicated heat transfer processes such as dry heat loss, and possible condensation inside clothing. The mass loss method was always the correct option for clothing 35
61 evaporative resistance testing conducted under isothermal conditions. The isothermal heat loss method can be used provided that a correction is made on the real evaporative heat loss or the measurement is performed in a real isothermal condition (in such a condition both the heat loss and mass loss methods should give the same evaporative resistance). 4.4 Localised boundary air layer and clothing evaporative resistance for local body segments (Paper IV) Individual effects on localised boundary air layer s evaporative resistance At an air velocity range of 0.18 to 0.78 m/s, the localised boundary air layer s evaporative resistance decreases linearly with the increasing air velocity (walking speed w=0 m/s). However, its reduction rate differs significantly at different body segments. Reduction rates at the face, upper arm, hand and foot at an air velocity of 0.78 m/s are the lowest, ranging from 48.6 to 55.9%. The head, shoulders, back and thigh have the greatest reduction, ranging from 72.5 to 86.9%. The individual walking effect on localised evaporative resistance at a reference air velocity of 0.18 m/s was also examined. It was found that the walking speed decreases localised evaporative resistance at the extremities much more than on other segments. Interestingly, the reduction rate at the thigh was the greatest, when the manikin was walking at 1.17 m/s compared with a standing posture (reduction: 64.8%, i.e., kpa m 2 /W). The reduction of localised evaporative resistances at segments such as the face, head and chest were less than 10% of that on the thigh. Moreover, the reduction of localised evaporative resistance at the forearm was greater than that on the upper arm. This was mainly because the arm swing created a local turbulent air flow which led to a stronger decrease in the evaporative resistance at the manikin torso (e.g., shoulders and back) than at face. It was also found that the smaller the diameter of a local segment (such as the hand, forearm, calf and foot), the smaller the localised evaporative resistance (i.e., 36
62 the higher the localised evaporative heat transfer coefficient, the greater the evaporative capacity). The results were consistent with Belghazi et al. s findings (2005), where the effect of air velocity on whole body and regional evaporative heat transfer coefficients was examined in neonates using a baby manikin. The intersegment differences between upper limbs and the torso ranged from %. Belghazi et al. (2005) observed that the differences were 30% on their baby manikin. One possible reason for this could be that their baby manikin has a relatively small body surface area compared with the adult manikins used in this study. The evaporative heat transfer coefficients at those extremities had greater values than those at the torso. Thus, the evaporative resistances at segments such as the hands, feet, and limbs were smaller than those at the torso such as the back, shoulders, waist, and chest. The results presented in this study showed good agreement with De Dear et al. s study (1997), where the convective heat transfer coefficients of the hands, feet and peripheral limbs were found higher than the central torso regions. Localised convective heat transfer coefficients at the anterior body segments were much greater than those at the posterior segments due to laminar air flows from the front wall facing the manikin s anterior segments to the back wall. The localised evaporative heat transfer coefficients were greater at the front than those at the back accordingly. Hence, localised evaporative resistances at the front segments were smaller than those at the back. The data determined at the reference condition (v a =0.18 m/s, w=0 m/s) were in good agreement with the above theoretical analysis. The localised evaporative resistances at the chest, stomach, and waist were , and kpa m 2 /W, respectively. In contrast, localised evaporative resistances at the shoulders and back were and kpa m 2 /W respectively. They were % greater than those observed at the anterior body segments. 37
63 4.4.2 Combined effect on localised boundary air layer s evaporative resistance It was observed that body movement has greater influence on the extremities such as the forearm, hand, thigh, calf and foot than on the torso. At high wind speeds, body movement has very little effect on the localised evaporative resistance. At higher walking speeds, the wind has a smaller effect than at lower walking speeds. This trend became even more obvious at the body extremities such as the hands, feet, thigh, and arms. These findings are line with the findings of Havenith et al. (1990), where the changes of clothing vapour resistance with posture, movement and wind were investigated on human subjects Combined effect on localised clothing evaporative resistance The relation between air velocity, walking speed, and fabric weight and correction factors for localised clothing evaporative resistance was determined by multiple non-linear regressions. The correction equation can be written as R Corr R etr et 2 2 e exp a ( v 0.13) b ( v 0.13) c w d w W R a a f et Eq.(4-3) where, a, b, c, d and e are coefficients; v a is the wind speed relative to the manikin inside the climatic chamber, m/s (range: m/s); w is the walking speed, m/s, (range: m/s); W f is the fabric weight (range: g/m 2 ). The coefficients a, b, c, d and e, correlation factor R 2, and SEE (standard errors of the estimate) values for each local body segment are displayed in Table 4.1. Table 4.1 Coefficients, correlation factors and SEE values of the reduction equations (localised clothing evaporative resistance). 38
64 Segment a b c d e R 2 SEE Chest Shoulders Stomach Back Upper arm Forearm Waist Hip Thigh Calf Moisture transfer became more complex when clothing ensembles were involved. The clothing ventilation caused by body posture, body movement, wind, air gap and apertures of clothing (open/close) can greatly affect localised clothing evaporative resistance. The observed reductions at the limbs such as upper arm, forearm, thigh and calf were greater than these generated by the empirical equation given in the ISO 9920 (2007) standard. On the other hand, reductions at some local body segments, such as the chest and shoulders, were smaller than those produced by this equation. Therefore, the empirical equation (i.e., Eq.38) presented in the ISO 9920 (2007) standard may not be suitable for estimating localised clothing evaporative resistance. The empirical equations presented in this study provide a good alternative for its estimation. The conclusion of Paper IV was that the local moisture transfer property inside clothing should be characterised by localised evaporative resistance rather than by clothing total evaporative resistance. The total evaporative resistance provided very limited information. In addition, the localised resultant evaporative resistance caused by air and body movement varied considerably, which depended on local body shape, position and local ventilation characteristics. It was thus concluded that the localised evaporative resistance was important for the study of local body thermal comfort and for human-clothing-environment modelling. 39
65 4.5 Application of clothing evaporative resistance in the PHS model (Papers V and VI) Comparison of predicted and observed physiological data A PHS model program developed by Malchaire (2009, version ) was used in Paper V. In the study presented in Paper VI, this PHS program was firstly modified and later applied to generate predictions. The main modification was that the starting rectal and skin temperatures in the program were set equal to pre-exercise experimental values observed at each test scenario. In order to ensure that all input data were accurate, input values were precisely determined using relevant equipment. The predicted sweat rates in clothing ensembles MIL, CLM and FIRE at both 20.0 and 30.0 C were significantly greater than the observed values (p 0.05). In contrast, the predicted evaporation rates were significantly underestimated for all test scenarios except for clothing ensemble L and HV at WBGT=19.0 C (p 0.05). Nevertheless, the predicted sweat rates in L and HV at those two temperatures were in close agreement with the experimental data. The sweat accumulation in HV, MIL, and CLM after 70 min in the warm and high humidity environment (i.e., 20.0 C, RH=87%) were 53, 70 and 127 g, respectively (expressed as the percentage of produced sweat: 25.1, 29.6, and 43.6%). Similarly, for all clothing ensembles at 30.0 C, the sweat accumulations were 92, 56, 78, 216 and 364 g for clothing ensembles L, HV, MIL, CLM and FIRE (expressed as the percentage of produced sweat: 22.1, 13.5, 17.9, 39.8, and 52.7%), respectively. No differences in sweat accumulation were registered in clothing ensembles L, HV and MIL at those two thermal environments. However, there was a much higher percentage of sweat accumulation in CLM and FIRE. At 40.0 C, the subjects were significantly dehydrated during FIRE (p 0.01), with a mean body weight loss of 0.96 kg, which accounted for about 1.2 % of their total body weight. The predicted sweat rate during HV was significantly higher than the experimental data. The predicted 40
66 values in clothing MIL and FIRE fell within the observed range. The mean evaporation rate for all three clothing ensembles (i.e., HV, MIL, FIRE) remained at the same level. The predicted evaporative rate for all three scenarios was still much lower than the experimental data. The PHS model (ISO 7933) demonstrated good performance in predicting the skin temperature for clothing MIL and CLM at both 20.0 and 30.0 C. Nevertheless, there was a large discrepancy between the predicted and observed skin temperatures in light clothing such as HV. The predicted skin temperature curve showed an initial rate of rise much greater than the experimental data in the first 10 min, and then adopted a relatively constant temperature plateau. The predicted post-exercise skin temperature was 2.01 C higher than the experimental data. 41
67 42
68 Fig.4.5 Some weak predictions generated by the PHS model. [Reprinted with permission] The predicted rectal temperature curves in clothing ensembles MIL and CLM at 20.0 C closely followed the experimental curves. However, for clothing HV at 20.0 C, the post-exercise rectal temperature was 0.56 C lower than the observed value (see Fig.4.5). Moreover, the predicted rectal temperature curves at 30.0 C in clothing ensembles L, HV and MIL also showed good predictions; nevertheless, the predicted rectal temperature curves in CLM rose above the observed curve after about 45 min. Similarly, the predicted rectal temperature curve stayed above the still rising experimental curve after 15 min. Finally, the predicted post-exercise 43
69 rectal temperatures in CLM and FIRE at 30.0 C were 0.92 and 2.12 C higher than the observed values. In the hot environment (i.e., 40.0 C), the predicted core temperature curves in HV and MIL followed the observed curves, although the initial rate of rise was slightly greater than experimental curves because different initial starting points were used. However, the core temperature prediction curve for FIRE showed a much greater rise than the observed curve. The predicted rectal temperature after 63 min was 1.8 C higher than the observed value. For all predicted skin temperature curves at 40.0 C, there was a much shallower rise during the first 30 min and the predicted values were continuously lower than the still rising observed curves. Table 4.2 The RMSD and mean SD of experimental data. T a ( C) Cloth. HV MIL CLM L HV MIL CLM FIRE HV MIL FIRE RMSD (Tre) SD RMSD (Tsk) SD The root mean standard deviation (RMSD) was used to examine the prediction accuracy of the PHS model (see Table 4.2). Generally, if the RMSD is greater than the average mean standard deviation (SD) of the experimental data (i.e., RMSD>SD), the prediction will be treated as unreasonable. It can be deduced from Table 4.2 that the PHS model performed well in clothing ensemble CLM at 20.0 C, and clothing ensembles L, HV and MIL at 30.0 C. However, for the other 7 test scenarios, the PHS model generated either unreasonable rectal temperature or unreasonable skin temperature. In particular, the PHS model had both unreasonable rectal and skin temperatures for test scenarios involving FIRE at 30.0 and 40.0 C. The reason was obvious: the thermal insulation of the 44
70 protective clothing FIRE lies well beyond the application range of the model (the PHS model has only a valid thermal insulation range of clo). Since the PHS model excludes almost all protective clothing and people who wear such clothing are more often suffer great heat strain, there is a great need for the improvement of the PHS model in order to include such high insulation protective garments. Although test scenarios such as HV at both 20.0 and 40.0 C were well within the valid range of the PHS model, it still generated unreasonable predictions. One possible reason was that the skin temperature prediction formula used in the PHS model has the poorest and lowest correlation when a clothed subject exercised at a humidity level above 2.0 kpa (Mehnert et al. 2000). Thus, a further revision of the PHS model was required to gain better applicability and wider acceptance Suggestions on further revision of the PHS model The Paper V (Wang et al. 2011b) has clearly demonstrated that the PHS model was inapplicable for protective clothing and those trials conducted in high humidity conditions (RH>80%). The model generated relatively conservative data on the evaporation rate and the duration limited exposure and thus, the worker s productivity was highly reduced. In order to maximise the worker s productivity but keep them safe, it is necessary to revise the current PHS model and extend its applicability. Firstly, the skin temperature equation was developed from a purely statistical manner; some clothing factors such as insulation, evaporative resistance and condensation were removed from the equation. Thus it cannot reflect all heat transfer characteristics (Sakoi et al. 2006). The low predictive ability of the skin temperature also introduced a large error into the calculation of the heat exchange between the human body and environments. Secondly, the calculation of the maximal evaporation rate in the PHS model was deduced from the water vapour pressure gradient between the skin surface and the environment and dynamic clothing evaporative resistance. This neglected the effect of absorbed sweat on 45
71 clothing. The liquid sweat may be absorbed by garments and transported from the skin surface to the outer clothing surface. Thus, the amount of liquid transported to the clothing outer surface should not be restricted by the clothing. The sweat also wet the clothing and reduced the resultant evaporative resistance. Consequently, the predicted evaporation rate was underestimated while the body core temperature was overestimated. Clothing input data such as the thermal insulation and permeability index should not be taken from tables because such data were far from accurate. One of the most reliable ways was to measure such inputs on a sweating thermal manikin. However, it was suggested that the evaporative resistance could be used to replace the permeability index. In addition, a correction of the wind and body effects on dynamic evaporative resistance may be used. Similarly, the metabolic rate was usually taken from the reference table specified in ISO 7933 (2004). This kind of estimation may be inaccurate too. Previous studies showed that estimation of the metabolic rate can introduce an error of up to 60% (NIOSH 1986; ISO8996 [2004]; Dorman 2007). The best way was to measure the oxygen uptake using a cardiopulmonary instrument and the measurement error can be reduced to ±5%. 46
72 5. Extended discussion Currently, there are two international standards describing thermal manikin measurements or estimations of clothing evaporative resistance: ISO 9920 (2007) and ASTM F2370 (2010). ISO 9920 offers two basic estimation options: using tables with data determined on standing thermal manikins or deducing from thermal resistance through the Lewis relation. In addition, the measurement of clothing evaporative resistance on sweating manikins is summarised in this standard as an annex. However, no detailed test protocol is given. In contrast, the ASTM F2370 (2010) is the only standard presenting a detailed test protocol on manikin measurement of clothing evaporative resistance. In the aforementioned two standards, many open details need to be clarified. Apart from the open issue on different sweating simulation options, how to select a reasonable calculation option between the two is not well described in the standard. Similar to calculation options listed in clothing thermal insulation standards (e.g., ISO 15831[2004]; EN 342[2004]), both the ISO 9920 and ASFM F2370 provide two calculation options. No recommendation has been made for researchers and industrial technicians on how to select one based on testing environment and tested garments. This definitely adds difficulty to select a reasonable value for both models and standards dealing with heat stress. How to select a calculation option for clothing evaporative resistance measurements performed in a so-called isothermal condition was addressed in Paper III. It should be noted that conclusions were made from a purely physical point of view. Basically, evaporative resistance is an inherent physical parameter; it would always be good to have a baseline value. For measurements conducted in real isothermal condition (T sk,f =T a =T r ), the mass loss and heat loss should generate the same value. Therefore, both methods can be selected for calculation. The value determined under such a condition should be reported by industrial 47
73 firms when informing the consumers. At present, it seems very difficult to create a real isothermal condition for sweating thermal manikins. All reported experiments have treated the so called condition of T manikin =T a =T r as an isothermal condition. It can be learnt from the Paper III that the mass loss option should be used for calculation because the heat loss option overestimated the evaporative resistance. However, from a physiological point of view, the mass loss method underestimated much more heat stress compared with the heat loss method. This is mainly because, in real cases, the evaporative heat used for sweat evaporation usually comes from both the environment and the body. Thus, if clothing evaporative resistance is intended to be used as an input in heat stress models, the isothermal heat loss method should be used. Under non-isothermal conditions, complicated heat and mass transfer processes made comparison of the two calculation options even more difficult. Previous studies (Havenith et al. 2008a; Wang et al. 2009; Kuklane, Gao and Wang, personal communications 2011) have shown that the two calculation options may generate totally different values. Generally, the difference becomes even more obvious in impermeable clothing in cool environments (Havenith et al. 2008b). The mass loss method may produce a higher value than the heat loss method due to that it can only detect part of the heat loss leaving the manikin-clothing system. Nevertheless, the amount of moisture participating in condensation will not leave the clothing system but does take away heat from the thermal manikin to the environment. Therefore, the mass loss overestimates the heat stress from a physiological point of view. In summary, the clothing evaporative resistance determined in a condition can only represent the garment characteristics at that specific condition. The data determined in some non-isothermal conditions may be treated as apparent evaporative resistance. Further, the mass loss method may not be suitable for calculating apparent evaporative resistance from a physiological point of view. 48
74 6. Conclusions This thesis presents the results of extensive thermal manikin studies and human subject studies that were performed to describe clothing evaporative resistance measurements using sweating thermal manikins and its application in the heat strain model. The main findings of this thesis are summarised as follows: The use of manikin surface temperature instead of wet fabric skin temperature can introduce an error of up to 35.9% on the boundary air layer s evaporative resistance R ea. In contrast, its use generated an error of up to 23.7% on the clothing total evaporative resistance R et, which was dependent on the clothing intrinsic evaporative resistance R ecl. It was also found that the prevailing calculation method for evaporative resistance causes greater error on permeable clothing than on impermeable clothing. The universal equation for the prediction of sweating skin temperature on the Tore thermal manikin was T sk,f = HL. Isothermal was the most preferred test condition for measurements of clothing evaporative resistance. From a physical point of view, the isothermal mass loss method was always the correct calculation option for calculating clothing evaporative resistance. Localised evaporative resistances at segments such as the hands, feet, and limbs were smaller than those at the torso such as the back, shoulders, waist, and chest. Localised convective heat transfer coefficients at the anterior body segments were much greater than those at the posterior body segments. Thus the localised evaporative resistances at the anterior segments were smaller than those at the posterior segments. Body movement has a greater influence on the extremities (such as the forearm, hand, thigh, calf and foot) than on the torso. At high wind speeds, body movement has very little effect on localised evaporative resistance. At higher walking speeds, wind has a smaller effect than at lower walking speeds. 49
75 The reduction equations developed for localised clothing evaporative resistance have demonstrated that a total evaporative resistance value cannot always characterise the local clothing property. Thus, the localised value should be used instead of a total value when reporting results. The PHS model (ISO 7933) was not applicable for the prediction of core and skin temperatures for high insulation protective clothing. Although the predicted sweat rate was well within the observed ranges, the predicted evaporation rate was greatly underestimated. The PHS model (ISO 7933) should be revised by performing more human subject tests or applying sensitive mathematical equations in order to gain wide acceptance. 50
76 7. Future study Most of the current thermal manikin technology on sweating simulation separates the fabric skin from the manikin controlling system, which means that the wet fabric skin surface temperature is always lower than the manikin surface temperature (due to water evaporation). A further step would be to establish a feedback system as a bridge between the wet fabric skin and the manikin controlling system. The local information on the wet skin can be obtained by embedding flexible temperature sensors and relative humidity sensors. The data collected from these temperature and RH sensors can be used as feedback. In addition, such a feedback system can also be used to control the skin wettedness. Since our bodies seldom have fully wet skin in our daily life and work, this improvement would be very useful in order to mimic different levels of the human skin wettedness. Another future study will focus on creating a real isothermal testing condition by setting and regulating the wet fabric skin surface temperature to the air temperature and the mean radiant temperature (T sk,f =T a =T r ). In such a testing condition, both the heat loss option and mass loss option will be used to calculate clothing evaporative resistance, which in turn can be used as a reference value for both garment manufacturers and wearers. Such a test condition may also be deemed as the most ideal test environment for measurements of clothing evaporative resistance using a sweating thermal manikin. More thermal manikin experiments are required to further improve the applicability of the empirical equations developed for localised clothing resultant evaporative resistance. More garments should be included in order to achieve better prediction accuracy on possible testing conditions. In order to extend the applicability of empirical equations developed in Paper IV, experiments in greater 51
77 wind speed environments need to be added because the normal outdoor air speed is above 1.0 m/s at most of workplaces. Furthermore, a round robin study on the determination of clothing evaporative resistance using different sweating thermal manikins at different laboratories may be required to examine the data reproducibility. The same strict protocol would be used and preferably, the conductions of all measurement would be supervised by the same researcher together with local researchers at different laboratories. Regarding the PHS model (ISO 7933), it should be further improved by conducting more human subject tests. The empirical equations such as the mean skin temperature prediction equation might be replaced by several equations for different situations. For instance, the equation when T sk <T a should be different than when T sk >T a because the radiative heat transfer direction is totally different under these two conditions. The predicted evaporation rate should also be improved because it is highly underestimated by the equation adapted in the model. 52
78 8. References ACGIH (2001) Heat Stress and Heat Strain. American Conference of Governmental Industrial Hygienists (ACGIH), Cincinnati, OH Anttonen H, Niskanen J, Meinander H, Bartels V, Kuklane K, Reinertsen RE, Varieras S and Sołtyński K (2004) Thermal manikin measurements exact or not?. Int. J. Occup. Saf. Ergon. 10: Apeagyei PR (2010) Application of 3D body scanning technology to human measurement for clothing fit. Int. J. Digital Content Technol. Appl. 4:58-68 ASHRAE (1997) Thermal Comfort. In: ASHRAE Fundamental Handbook, American Society of Heating, Refrigerating and Air-Conditioning Engineers, Atlanta, GA ASTM F2370 (2010) Standard test method for measuring the evaporative resistance of clothing using a sweating manikin. American Society for Testing and Materials, West Conshohocken, PA Azer NZ, Monall PE and Leung HC (1972) Effects of heat stress on performance. Ergonomics 15: Bankvall C (1973) Guarded hot plate apparatus for the investigation of thermal insulations. Mater. Struct. 6:39-47 Belghazi K, Elabbassi EB, Tourneux P and Libert JP (2005) Assessment of whole body and regional evaporative heat loss coefficients in very premature infants using a thermal mannequin: influence of air velocity. Med. Phys. 32:752-8 Beshir MY, El-Sabagh AS and El-Nawawi MA (1981) Time on task effect on tracking performance under heat stress. Ergonomics 24: Blood K and Burke R (2010) Further validation of the model-controlled Newton thermal manikin against historical human studies. In: Proceedings of the 8th International Meeting on Thermal Manikin and Modelling (8I3M), Victoria, Canada, Aug Brake R and Bates G (2002) A valid method for comparing rational and empirical heat stress indices. Ann. Occup. Hyg. 46:
79 Brown RP (2006) Physical Testing of Rubber (4th edition). Springer Science Business Media Inc., New York, USA, ISBN: Burke R, Blood K, Deaton AS and Barker R (2010) Application of model-controlled manikin to predict human physiological response in firefighter turnout gear. In: Proceedings of the 8th International Meeting on Thermal Manikin and Modelling (8I3M), Victoria, Canada, Aug Cadarette B, Montain S, Kolka M, Stroschein L, Matthew W and Sawka M (1999) Cross validation of USARIEM heat strain prediction models. Avia. Space Environ. Med. 70: Camenzind M, Weder M and den Hartog E (2001) Influence of body moisture on the thermal insulation of sleeping bags. In: RTO HFM Symposium on Blowing Hot and Cold: Protecting Against Climatic Extremes, Dresden, Germany, Oct. 2001, RTO-MP-076 Cengel YA (2002) Heat transfer: a practical approach. McGraw-Hill Publishing, New York Colin J and Houdas Y (1967) Experimental determination of coefficient of heat exchanges by convection of human body. J. Appl. Physiol. 22:31-8 De Dear RJ, Arens E, Zhang H and Oguro M (1997) Convective and radiative heat transfer coefficients for individual human body segments. Int. J. Biometeorol. 40: Dorman LE (2007) The effects of protective clothing and its properties on energy consumption during different activities. PhD Thesis, Loughborough University, Leicestershire, UK DuBois D and DuBois EF (1916) A formula to estimate surface area if height and weight are known. Arch. Intern. Med. 17:863 EN 342 (2004) Protective clothing Ensembles and garments for protection against cold.. European Committee for Standardization, Brussels Fan J and Chen YS (2002) Measurement of clothing thermal insulation and moisture vapour resistance using a novel perspiring fabric thermal manikin. Meas. Sci. Technol. 13:
80 Fan J and Qian X (2004) New functions and applications of Walter, the sweating fabric manikin. Eur. J. Appl. Physiol. 92:641-4 Fanger PO (1967) Calculation of thermal comfort: introduction of a basic comfort equation. ASHRAE Trans. 73:III4.1 Fiala D, Lomas KJ and Stohrer M (1999) A computer model of human thermoregulation for a wide range of environmental conditions: the passive system. J. Appl. Physiol. 87: Frackiewicz-Kaczmarek J, Psikuta A, Rossi RM and Bueno MA (2011) Distribution of the air gap thickness in casual clothing. In: Kounalakis S and Koskolou M (eds) Proceedings of the 14thInternational Conference on Environmental Ergonomics (ICEE), Nafplio, Greece, 2011, pp Gagge AP and Gonzalez RR (1996) Mechanisms of heat exchange: biophysics and physiology. In: Fregly MJ and Biatteis CM (eds.) Handbook of Physiology Sect 4: Environmental Physiology. The American Physiological Society, Bethesda, MD, pp Gao C, Kuklane K and Holmér I (2005) Using 3D whole body scanning to determine clothing area factor. In: Holmér I, Kuklane K and Gao C (eds.) Proceedings of the 11th International Conference on Environmental Ergonomics, Ystad, Sweden, May 2005, pp Gibson P, Auerbach M, Giblo J, Teal W, Endrusick T (1994) Interlaboratory evaluation of a new sweating guarded hot plate test method (ISO11092). J. Build. Phys. 18: Givoni B and Goldman R (1972) Predicting rectal temperature response to work, environments and clothing. J. Appl. Physiol. 32: Glazer JL (2005) Management of heatstroke and heat exhaustion. Am. Fam. Physician. 71: Goldman RF (2005) The four Fs of clothing comfort. In: Tochihara Y and Ohnaka T (eds.) Environmental Ergonomics: the Ergonomics of Human Comfort, Health and Performance in the Thermal Environment, Vol.3, Elsevier Ergonomics Book Series, pp
81 Goldman RF and Kampmann B (2007) Handbook on clothing: biomedical efects of military clothing and equipment systems. Available from Havenith G, Bröde P, Candas V, den Hartog E, Holmér I, Kuklane K, Meinander H, Nocker W, Richards M and Wang X (2009) Evaporative cooling in protective clothing: efficiency in relation to distance from skin. In: Castellani JW and Endrusick TL (eds.), Proceedings of the 13th International Conference on Environmental Ergonomics (ICEE), Boston, Aug. 2009, pp.20-4 Havenith G, Heus R and Lotens WA (1990) Clothing ventilation, vapour resistance and permeability index: changes due to posture, movement and wind. Ergonomics 33: Havenith G and Heus R (2004) A test battery related to ergonomics of protective clothing. Appl. Ergon. 35:3-20 Havenith G, Richards M, Wang X, Bröde P, Candas V, den Hartog E, Holmér I, Kuklane K, Meinander H and Nocker W (2008a) Apparent latent heat of evaporation from clothing: attenuation and heat pipe effects. J. Appl. Physiol. 104:142-9 Havenith G, Richards M, Wang X, Bröde P, Candas V, den Hartog E, Holmér I, Kuklane K, Meinander H and Nocker W (2008b) Use of clothing vapour resistance values derived from manikin mass losses or isothermal heat losses may cause severe under and over estimation of heat stress. In: Silva MCG (ed.) Proceedings of the 7th International Meeting on Thermal Manikin and Modelling. University of Coimbra, Portugal, Sept. 2008, pp.1-2 Holmér I (1995) Protective clothing and heat stress. Ergonomics 38: Holmér I (2004) Thermal manikin history and applications. Eur. J. Appl. Physiol. 92:614-8 Holmér I (2006) Protective clothing in hot environments. Ind. Health 44: Holmér I and Elnäs S (1981) Physiological evaluation of the resistance to evaporative heat transfer by clothing. Ergonomics 24:
82 Holmér I and Nilsson H (1995) Heated manikins as a tool for evaluating clothing. Ann. Occup. Hyg. 39: Horn MJ and Gurel LM (1981) The second skin: an interdisciplinary study of clothing. Houghton Mifflin Press, Boston Huang J (2006) Sweating guarded hot plate test method. Poly. Test. 25: Huck J (1988) Protective clothing systems: atechnique for evaluating restriction of wearer mobility. Appl. Ergo. 19: Ichihara M Saitou M, Nishimura M and Tanabe S (1997) Measurement of convective and radiative heat transfer coefficients of standing and sitting human body by using a thermal manikin. J. Archit. Plann. Environ. Eng. 501:45-51 ISO (2005) Ergonomics of the thermal environment Assessment of the influence of the thermal environment using subjective judgement scales. International Organization for Standardization, Geneva ISO (2004) Clothing Physiological effects measurement of thermal insulation by means of a thermal manikin. International Organization for Standardization, Geneva ISO 7243 (1994) Hot environments Estimation of the heat stress on working man, based on the WBGT-index. International Organization for Standardization, Geneva ISO 7933 (1989) Hot environments Analytical determination and interpretation of thermal stress using calculation of required sweat rates. International Organization for Standardization, Geneva ISO 7933 (2004) Ergonomics of the thermal environment Analytical determination and interpretation of thermal stress using calculation of the required heat strain. International Organization for Standardization, Geneva ISO 8996 (2004) Ergonomics of the thermal environment Determination of metabolic rate. International Organization for Standardization, Geneva ISO 9920 (2007) Ergonomics of the thermal environment Estimation of thermal insulation and water vapour resistance of a clothing ensemble. International Organization for Standardization, Geneva 57
83 Jay O and Kenney GP (2010) Heat exposure in the Canadian workplace. Am. J. Ind. Med. 53: Keiser C (2007) Steam Burns: moisture management in firefighter protective clothing. PhD Thesis, The Swiss Federal Institute of Technology (ETH), Zurich, Switzerland Keiser C, Becker C and Rossi RM (2008) Moisture transport and absorption in multilayer protective clothing fabrics. Text. Res. J. 78: Kenney WL, Lewis DA, Hyde DE, Dyksterhouse TS, Armstrong CG, Fowler SR and Williams DA (1987) Physiologically derived critical evaporative coefficients for protective clothing ensembles. J. Appl. Physiol. 63: Kim EA, Yoo S and Kim J (2003) Development of a human-clothing-environment simulator for dynamic heat and moisture transfer properties of fabrics. Fiber. Polym. 4: Knochel JP (1989) Heat stroke and related heat stress disorders. Dis. Mon. 35: Kuwabara K, mochida T, Nagano K and Shimakura K (2005) Experiments to determine the convective heat transfer coefficient of a thermal manikin. In: Tochihara Y and Ohnaka T (eds.) Environ. Ergo. pp Li Y and Wong ASW (2006) Clothing Biosensory Engineering. Woodhead Publishing Limited, Cambridge LoVecchio F, Pizon AF, Berrett C and Balls A (2007) Outcomes after environmental hyperthermia. Am. J. Emerg. Med. 25:442-4 Madsen TL (1989) A new generation of thermal manikins. Thermal Insulation Laboratory, Technical University of Denmark, Copenhagen Malchaire JBM (2006) Occupational heat stress assessment by the predicted heat strain model. Ind. Health 44:380-7 Malchaire JBM (2009) A program of the PHS model based on VBA. Available from: accessed on 4 Sept., 2011 Malchaire J, Kampmann B, Havenith G, Mehnert P and Gebhardt HJ (2000) Criteria for estimating acceptable exposure times in hot working environments: a review. Int. Arch. Occup. Environ. Health 73:
84 Malchaire J, Piette A, Kampmann B, Havenith G, Mehnert P, Holmér I, Gebhardt H, Griefahn B, Alfano G and Parsons K (2001) Development and validation of the predicted heat strain model. Ann. Occup. Hyg. 45: Mattle N (2000) Use sweating articulated manikin SAM for thermophysiological assessment of complete garments. In: Nilsson HO and Holmér I (eds.) Proceedings of the 3rd International Meeting on Thermal Manikin Testing (3IMM), Arbete och Hälsa, Stockholm, pp.100-1, ISBN: McCullough EA (2001) Interlaboratory study of sweating thermal manikins. In: Richards MGM (ed.) Proceedings of the 4th International Meeting on Thermal Manikin. EMPA, Switzerland, Sept McCullough EA, Huang J and Deaton S (2005) Methods for measuring the clothing area factor. In: Holmér I, Kuklane K and Gao C (eds.) Proceedings of the 11th International Conference on Environmental Ergonomics(ICEE), Ystad, Sweden, May 2005, pp McCullough EA, Kwon M and Shim H (2003) A comparison of standard methods for measuring water vapour permeability of fabrics. Meas. Sci. Technol. 14: McMorris T, Swain J, Smith M, Corbett J, Delves S, Sale C, Harris RC and Potter J (2006) Heat stress, plasma concentrations of adrenaline, noradrenaline, 5- hydroxytryptamine and cortisol, mood state and cognitive performance. Int. J. Psychophysiol.61: Measurement Technology Northwest (MTNW) Inc. (2011) Newton-Sweating thermal manikin. Accessed on Aug. 8, 2011, available from the URL: Mehnert P, Malchaire J, Kampmann B, Piette A, Griefahn B and Gebhardt H (2000) Prediction of the average skin temperature in warm and hot environments. Eur. J. Appl. Physiol. 82:52-60 Meinander H (1992) Coppelius-a sweating thermal manikin for the assessment of functional clothing. In: Meinander H (ed.) Proceedings of Nokobetef IV: Quality and Usage of Protective Clothing, Kittilä, Finland, Feb. 1992, pp , ISBN:
85 Meinander H (1997) Experience with a sweating thermal manikin-ready for standard use?. In: Nilsson H and Holmér I (eds.) Proceedings of a European Seminar on Thermal Manikin Testing (1IMM), Stockholm, 1997, pp Meinander H (2000) Extraction of data from sweating manikin tests. In: Nilsson HO and Holmér I (eds.) Proceedings of the 3rd International Meeting on Thermal Manikin Testing (3IMM), Arbete och Hälsa, Stockholm, pp.96-9, ISBN: Mochida T and Moriyama T (1998) Convective heat transfer coefficient for a manequivalent thermal cylinder. Bulletin of the Faculty of engineering, Hokkaido University, 140: (in Japanese) Nelson N, Eichna LW, Horvath SM, Shelly WB and Hatch TF (1947) Thermal exchanges of man at high temperature. Am. J. physiol. 151: Mitchell D, Wyndham CH, Vermeulen AJ, Hodgson T, Atkins AR and Hofmeyr HS (1969) Radiant and convective heat transfer of nude men in dry air. J. Appl. Physiol. 26: NIOSH (1986) Occupational exposure to hot environments. DHHS Publication No National Institute for Occupational Safety and Health (NIOSH), Washington DC Nishi Y and Gagge AP (1970) Direct evaluation of convective heat transfer coefficient by naphthalene sublimation. J. Appl. Physiol. 29:830-8 Parsons KC (2003) Human thermal environments: the effects of hot, moderate and cold environments on human health, comfort and performance. Taylor & Francis, Hampshire Psikuta A (2009) Development of an artificial human for clothing research. PhD Thesis, De Montfort University, Leicester, UK Psikuta A, Richards M and Fiala D (2008a) Single- and multi-sector thermophysiological human simulators for clothing research. In: Silva MCG (ed.) The 7th International Meeting on Thermal Manikin and Modelling (7I3M). University of Coimbra, Portugal, Sept
86 Psikuta A, Richards M and Fiala D (2008b) Single-sector thermophysiological human simulator. Physiol. Meas. 29: Qian X and Fan J (2006) Prediction of clothing thermal insulation and moisture vapour resistance of the clothed body walking in wind. Ann. Occup. Hyg. 50: Ramanathan NL (1964) A new weighting system for mean surface temperture of the human body. J.Appl. Physiol.19:531-3 Redortier B and Voelcker T (2010) Implementation of thermo-physiological control on a multi-zone manikin. In: Proceedings of the 8th International Meeting on Thermal Manikin and Modelling (8I3M), Victoria, Canada, Aug Redortier B and Voelcker T (2011) A 38-zone thermal manikin with physiological control: validation for simulating thermal response of the body for sports exercise in cold and hot environment. In: Kounalakis S and Koskolou M (eds.) Proceedings of the 14th International Conference on Environmental Ergonomics(ICEE), Nafplio, Greece, 2011, pp.99 Reinhold M (1971) Usurpation of status and status symbols in the roman empire. In: Historia:Zeitschrift für Alte Geschichte, Franz Steiner Verlag Publishing, Wiesbaden, pp Richards MGM and Mattle N (2001) A sweating thermal manikin (SAM) developed to test complete clothing systems under normal and extreme conditions. In: RTO HFM Symposium, Blowing Hot and Cold: Protecting against climatic extremes, Vol.4, pp.1-7 Richards MGM and McCullough EA (2005) Revised Interlaboratory study of sweating thermal manikins including results from the sweating agile thermal manikin. J. ASTM Int. 2:1-13 Richards MGM, Psikuta A and Fiala D (2006) Current development of thermal sweating manikins at Empa. In: Fan J (ed.) Proceedings of the 6th International Meeting on Thermal Manikin and Modelling (6I3M), Hong Kong, Oct. 2006, pp
87 Sakoi T, Mochida T, Nagano K and Shimakura K (2006) Characteristics and consideration of required sweat rate standard of the previous ISO J. Human Environ. System 9:19-29 Salmon D (2001) Thermal conductivity of insulations using guarded hot plates, including recent developments and sources of reference materials. Meas. Sci. Technol. 12: R89-R98 Snellen JW, Mitchell D and Wyndham CH (1970) Heat of evaporation of sweat. J. Appl. Physiol. 29:40-4 Song G (2011) Improving comfort in clothing. Woodhead Publishing, Oxford Stolwijk JA and Hardy JD (1977) Control of body temperature. Reactions to Environmental Agents. The American Physiological Society, Bethesda, MD Tanabe S, Kobayashi K, Nakano J, Ozeki Y and Konishi M (2002) Evaluation of thermal comfort using combined multi-node thermoregulation (65MN) and radiation models and computational fluid dynamics (CFD). Energy Build. 34: Umbach KH (1983) Evaluation of comfort characteristics of clothing by use of laboratory measurements and predictive calculations. Proceedings of the International Conference on protective Clothing System, Stockholm, Sweden, pp Wang F, Gao C, Kuklane K and Holmér I (2009) A study on evaporative resistances of two skins design for thermal manikin Tore under different environmental conditions. J. Fiber Bioeng. Inform. 1: Wang F, Kuklane K, Gao C and Holmér I (2010) The development and validation of empirical equations to predict sweating skin surface temperature for thermal manikins under non-isothermal conditions. J. Therm. Biol. 35: Wang F, Gao C, Kuklane K and Holmér I (2011) Determination of clothing evaporative resistance on a sweating thermal manikin in an isothermal condition: heat loss method or mass loss method?. Ann. Occup. Hyg. 55: Wang F, Kuklane K, Gao C, Holmér I and Havenith G (2010) Development and validation of an empirical equation to predict sweating skin surface temperature for 62
88 thermal manikins. In: Li Y, Qiu Y, Luo X and Li J (eds.) The 3rd International Symposium on Textile Bioengineering and Informatics (TBIS2010). Shanghai, China, May 2010, pp Wang F, Kuklane K, Gao C and Holmér I (2011a) Effect of temperature difference between manikin and wet fabric skin surfaces on clothing evaporative resistance: how much error is there?. Int. J. Biometeorol. doi: /s z Wang F, Kuklane K, Gao C and Holmér I (2011b) Can the PHS model (ISO7933) predict reasonable thermophysiological responses while wearing protective clothing in hot environments? Physiol. Meas. 32: Werner J (1989) Thermoregulatory models. Scand. J. Work Environ. Health 15 (suppl 1):34-46 Winslow CEA, Gagga AP and Herrington LP (1939) The influenece of air movement upon heat losses from the clothed human body. Am. J. Physiol. 127: Wissler EH (1985) Mathematical simulation of human thermal behaviour using whole body models. In: Shitzer A and Eberhart C (eds.) Heat Transfer in Medicine and Biology, Plenum Press, London, pp Wu YS and Fan J (2009) Measuring the thermal insulation and evaporative resistance of sleeping bags using a supine sweating fabric manikin. Meas. Sci. Technol. 20: (9pp) Wyon D (1989) Use of thermal manikins in environmental ergonomics. Scand. J. Work Environ. Health 15 (suppl 1):84-94 Xu X and Santee WR (2011) Sweat loss prediction using a multi-model approach. Int. J. Biometeorol. 55:501-8 Xu X and Werner J (1997) A dynamic model of the human/clothing/environmentsystem. Appl. Human Sci. 16:61-75 Yarborough P and Nelson CN (2005) Performance of Protective Clothing: Global Needs and Emerging Markets. ASTM STP1462, American Society for Testing and Materials, West Conshohocken, PA, ISBN: Yu W, Wu YS and Fan JT (2011) Effect of posture positions on the evaporative resistance and thermal insulation of clothing. Ergonomics 54:
89 Zimmerli T (2000) Manikin testing of protective clothing-a survey. In: Nelson CN and Henry NW (eds.) Performance of Protective Clothing: Issues and Priorities for the 21 st Century, ASTM STP 1386, American Society for Testing and Materials, West Conshohocken, PA, pp Zimmerli T and Weder MS (1997) Protection and comfort- a sweating torso for the simultaneous measurement of protective and comfort properties of PPE. In: Stull JO and Schwope AD (eds.) Performance of Protective Clothing: Sixth volume, ASTM STP 1273, American Society for Testing and Materials, West Conshohocken, PA, pp
90 Appendix I: Glossary of terms Apparent total evaporative resistance The total evaporative resistance of the garment, liquid barrier and bounday air layer determined under a condition that condensation may occur within the garment (nonisothermal conditions) or the total evaporative resistance of the wetted clothing by either sweat, water or rain and boundary air layer. Boundary air layer s evaporative resistance The evaporative resistance of the surrounding air layer on the sweating fabric skin surface of the nude thermal manikin measured under isothermal conditions. Clothing area factor The ratio of the surface area of a clothed human body to the surface area of the nude body. It may be determined by a photograph method or on a 3D body scanner. Condensation Condensation occurs when the temperature of a vapour is reduced below its saturation temperature (Cengel 2002). In real cases, condensation can be easily achieved by bringing the vapour into contact with a solid surface whose temperature is below the vapour s saturation temperature. Condensation may also occur on the free surface of a liquid or even in gases when the temperature of the liquid or the gas to which the vapour is exposed is below the vapour s saturation temperature. Conduction The energy transfers from the more energetic particles of an object to the adjacent less energetic ones as a result of interactions between the particles. It can take place in solids, liquids or gases.in solids conduction is drived by combinations of molecules vibration in a lattice and the energy is transported by free electrons. In contrast, 65
91 conduction occurs in liquids and gases due to collisions and diffusion of the molecules during their random motion. Convection The mode of energy transfer between a solid surface and the adjacent liquid or gas that is in motion. It involves the combined effects of conduction and fluid motion. Intrinsic evaporative resistance The resistance to transport moisture vapour from one side of the garment to another side with a lower water vapour pressure (normally determined under isothermal conditions). Localised/regional evaporative resistance The clothing segmental evaporative resistance determiend on the multi-segment sweating manikin. Localised resultant evaporative resistance The clothing localised evaporative resistance determined on a sweating thermal manikin under a condition where air and/or body movement is involved. Radiation Electromagnetic radiation emitted from a heat or light source due to its temperature. It consists of ultraviolet, visible and infrared radiation. Resultant evaporative resistance The clothing evaporative resistance determined on the sweating thermal manikin at a condition where air and/or body movement is involved. Total evaporative resistance The clothing evaporative resistance of the garment and the boundary air layer around the sweating thermal manikin determiend under isothermal conditions. 66
92 Paper I
93
94 Int J Biometeorol DOI /s z ORIGINAL PAPER Effect of temperature difference between manikin and wet fabric skin surfaces on clothing evaporative resistance: how much error is there? Faming Wang & Kalev Kuklane & Chuansi Gao & Ingvar Holmér Received: 16 November 2010 /Revised: 5 January 2011 /Accepted: 24 January 2011 # ISB 2011 Abstract Clothing evaporative resistance is one of the inherent factors that impede heat exchange by sweating evaporation. It is widely used as a basic input in physiological heat strain models. Previous studies showed a large variability in clothing evaporative resistance both at intra-laboratory and inter-laboratory testing. The errors in evaporative resistance may cause severe problems in the determination of heat stress level of the wearers. In this paper, the effect of temperature difference between the manikin nude surface and wet textile skin surface on clothing evaporative resistance was investigated by both theoretical analysis and thermal manikin measurements. It was found that the temperature difference between the skin surface and the manikin nude surface could lead to an error of up to 35.9% in evaporative resistance of the boundary air layer. Similarly, this temperature difference couldalsointroduceanerrorofupto23.7%inthereal clothing total evaporative resistance (R et_real < kpa m 2 /W). Finally, it is evident that one major error in the calculation of evaporative resistance comes from the use of the manikin surface temperature instead of the wet textile fabric skin temperature. Keywords Evaporative resistance. Thermal manikin. Heat stress. Thermoregulatory model. Wet fabric skin temperature F. Wang (*) : K. Kuklane : C. Gao : I. Holmér Thermal Environment Laboratory, Division of Ergonomics and Aerosol Technology, Department of Design Sciences, Faculty of Engineering, Lund University, Lund, Sweden faming.wang@design.lth.se Introduction Protective clothing ensembles can greatly impede the heat exchange by sweat evaporation, one of the most important mechanisms that regulate a human body core temperature in hot environments. A vital limiting inherent factor of the clothing is its evaporative resistance. For the same amount of external work load, the greater the evaporative resistance of the clothing worn, the lesser the ability to cool the human body by sweat evaporation. Further, an evaporative resistance value means that a rational method, such as the predicted heat strain (PHS) model, can be used to assess the heat stress exposure (ISO ; Malchaire 2006). Moreover, the evaporative resistance is used to calculate the body heat balance and model the heat exchange between the human body and its environment. Finally, such modelling can provide useful information about the rate of the body core temperature rise and the heat exposure safety time limit (Fiala et al. 1999; Gonzalez et al. 1997; Kellett et al. 2001). Currently, there are three main approaches to measure the evaporative resistance of a piece of textile fabric or a garment (ASTM 2009, 2010; Holmér and Elnäs 1981; ISO ): sweating guarded hotplate, sweating thermal manikin and human subjects. A previous study (Ross 2005) has clearly demonstrated that the thermal manikin measurement provides a more realistic value than that determined by a sweating guarded hotplate. This is mainly because the thermal manikin test could evaluate the effect of garments boundary air layers and examine the contribution of clothing design features to the clothing evaporative resistance. The third approach mentioned above can be achieved by measuring the water vapour pressure gradient between the human skin and ambient air and the steady state rate of the evaporative heat loss (Holmér and Elnäs 1981). However, human trials are costly, and ethical issues
95 Int J Biometeorol are always involved. Therefore, the sweating thermal manikin is a perfect intermediate tool to bridge the gap between the sweating hot plate and physiological testing. A round-robin laboratory study on measurement of clothing evaporative resistance using different sweating thermal manikins has revealed a large variability in both intra- and inter-laboratory studies (McCullough 2001; Richards and McCullough 2005). The intra-laboratory repeatability of clothing intrinsic evaporative resistance was kpa m 2 /W for relatively permeable clothing. For impermeable clothing, the variability was kpa m 2 /W. The inter-laboratory reproducibility of intrinsic evaporative resistance for permeable clothing was kpa m 2 /W (i.e., 6 17% of the averaged values), and kpa m 2 /W (i.e., 39 46% of the mean values) for impermeable clothing ensembles. Those large discrepancies might be reasonably attributed to the limited capacity of climatic chambers, different manikin configurations, various sweating simulation methods and differences in detailed test setups and protocols. Although ASTM (2010) specifies that the calculation of clothing evaporative resistance should be based on the wet skin surface temperature rather than the manikin nude surface temperature, laboratory testing seldom measures the wet textile skin surface temperature by using sensors attached to the wet textile skin surface. It seems that the prevailing calculation on clothing evaporative resistance is based on the thermal manikin surface temperature (Wang et al. 2010). This might be attributed to the technical difficulty and complexity in putting temperature sensors on a wet textile fabric surface. In addition, the distance between wet textile fabric skin surface and the sensing point of the sensor greatly influences the observed temperature values (Fan and Chen 2002). Moreover, those values are highly dependent on the tightness of sensor attachment and which side of the temperature sensor is against the textile skin. Hence, very little work has been published on attaching temperature sensors to the wet textile fabric surface to measure its surface temperature. Recently, we conducted a series of skin experiments and developed a universal empirical equation to predict the wet textile skin surface temperature (Wang et al. 2010). It was found that the prevailing calculation method generated higher values than those calculated from the wet textile skin surface temperature. The error introduced by the temperature difference between manikin surface and wet textile skin surface, however, has not been thoroughly investigated. The main aim of this study was to examine the error in the temperature difference between the manikin nude surface and the wet textile surface and its effect on the evaporative resistance. The evaporative resistance of the boundary air layer was measured on a dry heated thermal manikin covered with a pre-wetted textile skin. In addition, the effect of the error introduced by the temperature difference between the manikin and wet textile skin surfaces on clothing total evaporative resistance was analysed theoretically. Finally, some suggestions on how to improve the measurement accuracy of the clothing evaporative resistance are summarised. Materials and methods Calculation on evaporative resistance At present, there is a single standard that describes the measurement of clothing evaporative resistance on a sweating thermal manikin (ASTM 2010; Huang2007a). It specifies the configuration of the thermal manikin and the test protocol as well as the test conditions. The sweating simulation for thermal manikins is still open because of the limited techniques for sweating simulation. This standard describes two options to calculate clothing evaporative resistance: the heat loss option and the mass loss option. These two calculation options are determined by Eqs. (1) and (2). Heat loss option: ð R et ¼ p sk p a ÞA ð1þ H e Mass loss option: ð R et ¼ p sk p a ÞA l dm dt ð2þ where, R et is the total evaporative resistance of the clothing, kpa m 2 /W; p sk is the saturated water vapour pressure at the wet textile skin surface, kpa; p a is the partial water vapour pressure in the environment, kpa; A is the wet textile skin surface area, m 2 (in this study, the surface area of the textile skin was assumed equal to the manikin surface area due to the textile skin is pretty thin and fits tightly over the manikin body); H e is the observed evaporative heat loss from the manikin, W; λ is the heat of vaporization of water at the measured textile skin temperature, kj/kg; the ratio of dm/dt is the evaporation rate of moisture leaving the manikin-clothing system, kg/h. The saturated water vapour pressure at wet textile skin surface and the partial vapour pressure in the air can be expressed by the so-called Antoine s equation (e.gs. Huang 2007b; Parsons 2003) p sk ¼ 0:1333 exp 18: :183 ð3þ t sk þ 235 p a ¼ 0:1333 exp 18: :183 RH a t a þ 235 ð4þ
96 Int J Biometeorol where, t sk is the mean fabric skin temperature, C; t a is the air temperature, C; RH a is the relative humidity in the ambient air, %. In order to examine the effect of temperature difference between the manikin surface and the wet textile skin surface on clothing evaporative resistance, two evaporative resistances were calculated. One was calculated based on the thermal manikin nude surface temperature (i.e., the prevailing method), and another was based on the wet textile skin temperature (i.e., the real evaporative resistance). Test procedures Twenty-two wet tests were conducted on a thermal manikin Tore (Wang et al. 2009) to examine the effect of temperature difference between the manikin nude surface and wet skin surface on the evaporative resistance. Fourteen dry tests were performed to measure the dry heat losses under non-isothermal conditions (i.e., t a = 30.0, 25.0, or 20.0 C). All dry and wet experiments were repeated twice in each environmental condition, with the results averaged. For wet skin experiments to determine the evaporative resistance of the boundary air layer, the manikin was covered with a knit cotton fabric skin (fabric mass per unit area: 228 g/m 2 )and wetted with tap water to simulate sweat-saturated skin. There were no coverings on the manikin s head, hands and feet. Thus, the total sweating surface area was m 2. The manikin surface temperature was controlled at 34.0 C (accuracy: ±0.1 C). The total or dry heat loss from the thermal manikin was continuously recorded by a MS DOS program (Nilsson 2004). The heat loss option (i.e., Eq. (1)) was used to calculate the evaporative resistance. Our recent thermal manikin studies (Wang et al. 2010) have demonstrated that there was no significant temperature difference between the wet textile skin inner surface and its outer surface. By attaching sensors on the manikin surface using waterproof surgical tapes (3M, USA) to measure the wet skin inner surface temperature, measurements are simplified but the accuracy is maintained. Thus, in this study, 12 temperature sensors (Sensirion SHT75, Switzerland; temperature accuracy: ±0.3 C; RH accuracy: ±1.8 %; response time: 8 s) were placed at 12 different manikin body sites (left upper arm, left lower arm, right lower arm, right upper arm, right scapula, right lower chest, left upper chest, left lower buttocks, right shin, left calf, right posterior thigh, and left anterior thigh) to measure the wet textile fabric skin inner surface temperature. The size of the temperature sensor is mm 3 (length width thickness). The thermistor sensing point was faced to the wet fabric skin side. Thus, the measured value comes from the wet fabric skin side. Three temperature and RH integrated sensors (Sensirion SHT75, Switzerland) set at heights of 0.1, 1.1 and 1.7 m were used to monitor the ambient temperature and relative humidity in the climatic chamber. The air inlets in the climatic chamber are from the mesh ceiling and air outlets are through the lower mesh part of one side wall. The air velocity for all dry and wet experiments was maintained at 0.33±0.09 m/s. The test conditions are illustrated in Table 1. Statistical analysis The Repeated Measures ANOVA (Analysis of Variance) was applied for within-subject comparison of the effect of temperature difference on the evaporative resistance. This was performed on the software SPSS version 16.0 (SPSS, Chicago, IL, USA). The statistical significance level was set at P<0.05. Results and discussion Evaporative resistance of the boundary air layer The calculated evaporative resistance values of the boundary air layer are displayed in Fig. 1. Theobserved wet textile skin temperatures were C lower than the manikin nude surface temperature (e.g. Fig. 2a c) because of the water evaporation (in non-isothermal conditions, dry heat loss also contributes to those reductions). As expected, the real evaporative resistances Table 1 Eleven test conditions used in the wet skin study t a ( C) RH real (%) P real (Pa) V a (m/s) , ± , , , , ± , , , ± , , ± ,643 The water vapour pressure in the climatic chamber was calculated from the temperature and RH values. It should be noted that the RH value set on the control panel should not be used to calculate clothing evaporative resistance. Otherwise, it may generate a large error on the calculated evaporative resistance. RH real The real observed RH value in the climatic chamber, P real the real water vapour pressure in the climatic chamber, V a the air velocity in the climatic chamber
97 Int J Biometeorol Fig. 1 The evaporative resistances of the boundary air layer calculated from the manikin nude surface temperature and the wet textile skin surface temperature (by the heat loss option). R ea_real The real evaporative resistance of the air layer calculated from the wet skin surface temperature; R ea the evaporative resistance of the air layer calculated from the manikin nude surface temperature; 34, 30, 25 and 20 are ambient temperatures ( C); 1, 2, 3 and 4 are the set partial water vapour pressures in the climatic chamber (kpa); *P<0.05 were much lower than the calculated evaporative resistances from the manikin nude surface temperature. The mean real evaporative resistance of the boundary air layer was kpa m 2 /W. The averaged evaporative resistance calculated from the manikin surface temperature was kpa m 2 /W. The statistical results showed a highly significant difference between the real evaporative resistances and evaporative resistances calculated from the manikin surface temperatures (P<0.001, Partial Eta Square=0.887, n=22). The calculation based on the manikin nude surface temperature produced errors on the evaporative resistance ranged from %. McCullough (2001) published a previous interlaboratory study report on the determination of clothing evaporative resistance using six different sweating thermal manikins. In this report, the evaporative resistance of the boundary air layer around the nude manikin ranged from to kpa m 2 /W for four laboratories except the other two laboratories at the North Carolina State University (NCSU, NC) and VTT Technical Research Centre in Finland. The two laboratories at NCSU and VTT used the same type of manikin that did not sweat in the head, hands and feet. The evaporative resistances of the boundary air layer were accordingly slightly higher at kpa m 2 /W. Similarly, the sweating thermal manikin Tore used in this study also did not sweat in the head, hands and feet. The mean real evaporative resistance of the boundary air layer presented in our study stays below this value. Clothing total evaporative resistance The clothing total evaporative resistance R et is the sum of the clothing intrinsic evaporative resistance R ecl and the evaporative resistance of the boundary surface air layer R ea (ASTM 2010), which is expressed by Eq.(5). The unit is kpa m 2 /W. R et ¼ R ecl þ R ea ð5þ f cl where, f cl is the clothing area factor, non-dimensional. Similarly, the real clothing total evaporative resistance R et_real (the total evaporative resistance calculated from the wet fabric skin surface temperature, kpa m 2 /W) is defined by Eq. (6): R et real ¼ R ecl þ R ea real f cl ð6þ It is assumed that the clothing intrinsic evaporative resistance R ecl is a constant value and also, that the measurement of clothing total evaporative resistance on a sweating thermal manikin will not introduce further errors on R ecl. Therefore, the error introduced by the temperature
98 Int J Biometeorol difference between the wet fabric skin and manikin surface on clothing evaporative resistance can be calculated by Eq. (7). ð Err ¼ R et real R et Þ R et real ð7þ By using Eqs. (5) and (6) and the two calculated mean evaporative resistances of the boundary air layer (i.e., R ea = kpa m 2 /W, R ea_real = kpa m 2 /W), Eq. (7) can be written as j Err ¼ R ea real R ea j 0:0068 ¼ R ecl f cl þ R ea real R ecl f cl þ 0: % ð8þ Many previous studies (Caravello et al. 2007; McCullough et al. 1989; McCullough 2001; McCullough and Kenney 2003; Richards and McCullough 2005; Wang et al. 2010) have demonstrated that the total evaporative resistance of most permeable and semi-permeable vocational clothing was below 0.10 kpa m 2 /W. Based on these findings, we assume that the intrinsic evaporative resistance of most clothing ensembles ranged from 0 to 0.10 kpa m 2 / W, and the corresponding clothing area factor ranged from 1.0 to 1.5 (McCullough et al. 1989). Thus, one has 0 < R ecl f cl 0:15 ð9þ Finally, the solution of Eq. (8) is given by 3:8% Err < 23:7% ð10þ Fig. 2 The mean inner surface temperature of the wet textile fabric skin at different test conditions. a Isothermal condition, t a =34.0 C, RH=44.3%; b non-isothermal condition, t a =30.0 C, RH=59.2%; c non-isothermal condition, t a =20.0 C, RH=51.5%. The wet textile fabric skin started to dry out after about 50 min. Thus, only the stablestate data (e.g. 30 min data) can be used for the calculation It is evident that the prevailing calculation based on the manikin nude surface temperature overestimates the real clothing total evaporative resistance by up from 3.8 to 23.7%. It should also be noted that the prevailing calculation generates a much larger error on permeable clothing than semi-permeable clothing or impermeable clothing. This is because the permeable clothing ensembles have low intrinsic evaporative resistance values. For impermeable clothing such as chemical protection clothing, the error introduced by the temperature difference might be neglected due to it having a relative high intrinsic evaporative resistance (i.e., the measured value could be 0.50 kpa m 2 /W or even higher; e.g. Gao and Holmér 2006). Generally, the required ambient air temperature could be attained rapidly and be accurately maintained by the current climatic chamber technology (±0.5 C). The ability of relative humidity control in the climatic chamber is mainly determined by the capacity of the dehumidifing and humidifing equipment in the chamber controlling system. In addition, the total and dry heat losses (or the mass loss rate) from the thermal manikin could be measured accurately by the manikin control program (or a weighing scale with a high enough accuracy, e.g. ±1 g). The evaporative heat loss could be calculated by deducting the dry heat loss from the total heat loss. Therefore,
99 Int J Biometeorol it can be easily deduced that major errors in calculating clothing evaporative resistance come from the measurement of wet skin surface temperature and the control accuracy of the RH value in the climatic chamber. Conclusions In summary, the wet textile skin temperature at each sweating thermal manikin s body segment should be measured by at least one temperature sensor in order to reduce the calculation error on clothing evaporative resistance. Also, better measurement techniques in testing the wet textile skin temperature will be available in the future, e.g. flexible distributed temperature sensors embedded in the textile fabric skin. The measurement accuracy will definitely be further enhanced if such solutions are available. The RH value in the climatic chamber should be measured by at least two RH sensors. Additionally, wet experiments must be performed in a climatic chamber where the RH value can be controlled within a reasonable range of the control value (±5%). The two calculation options presented in Eqs. (1) and (2) must be chosen according to the test conditions (Havenith et al. 2008). Moreover, clothing ensembles with different permeability properties need different test durations because the time taken by different clothing ensembles to reach the equilibrium condition is different (Gao and Holmér 2006). Finally, the determination of clothing evaporative resistance is a complicated process, and one of the main errors comes from the calculation of evaporative resistance using the manikin surface temperature. Acknowledgements This study was financially supported by Taiga AB in Varberg of Sweden. We are grateful to Scott C. Sheridan (the editor) and two anonymous reviewers for helpful comments. Conflict of interest References The authors declare no conflict of interest. ASTM (2009) ASTM F1868 standard test method for thermal and evaporative resistance of clothing materials using a sweating hot plate. American Society for Testing and Materials, Philadelphia, PA ASTM (2010) ASTM F2370 standard test method for measuring the evaporative resistance of clothing using a sweating manikin. American Society for Testing and Materials, Philadelphia, PA Caravello V, McCullough EA, Ashley CD, Bernard TE (2007) Apparent evaporative resistance at critical conditions for five clothing ensembles. Eur J Appl Physiol 104: doi: /s Fan J, Chen YS (2002) Measurement of clothing thermal insulation and moisture vapour resistance using a novel perspiring fabric thermal manikin. Meas Sci Technol 13: doi: / /13/7/320 Fiala D, Lomas KJ, Stohrer M (1999) Computer prediction of human thermoregulatory and temperature responses to a wide range of environmental conditions. Int J Biometeorol 45: doi: /s Gao C, Holmér I (2006) Initial, transient and steady state evaporative resistance of impermeable protective clothing. Proceedings of the Sixth International Meeting on Thermal Manikin and Modeling, Hong Kong, Oct.2006, pp Gonzalez R, McLellan T, Withey W, Chang S, Pandolf K (1997) Heat strain models applicable for protective clothing system: comparison of core temperature response. J Appl Physiol 83: Havenith G, Richards M, Wang X, Bröde P, Candas V, den Hartog E, Holmér I, Kuklane K, Meinander, Nocker W (2008) Use of clothing vapour resistance values derived from manikin mass losses or isothermal heat losses may cause severe under and over estimation of heat stress. Proceedings of the Seventh International Meeting on Thermal Manikin and Modeling, Portugal Holmér I, Elnäs S (1981) Physiological evaluation of the resistance to evaporative heat transfer by clothing. Ergonomics 24:63 74 Huang J (2007a) Assessment of clothing effects in thermal comfort standards: a review. J Test Eval 35: doi: /jte Huang J (2007b) Prediction of air temperature for thermal comfort of people in outdoor environments. Int J Biometeorol 51: doi: /s ISO (1993) Textiles Physiological effects Measurement of thermal and water vapour resistance under steady-state conditions (Sweating guarded hotplate test). International Organization for standardization, Geneva, Switzerland ISO 7933 (2004) Ergonomics of the thermal environment Analytical determination and interpretation of thermal stress using calculation of the required heat strain. International Organization for standardization, Geneva, Switzerland Kellett EM, Weller AS, Bentley M, Withey WR (2001) Application of a computer model to set heat strain threshold limit values: evaluation during a simulated army basic combat fitness test. Proceedings of RTO HFM Symposium on Blowing Hot and Cold: Protecting Against Climatic Extremes, Dresden, Germany, pp 1 5 Malchaire JBM (2006) Occupational heat stress assessment by the predicted heat strain model. Ind Health 44: McCullough EA (2001) Interlaboratory study of sweating thermal manikins. Proceedings of the Fourth International Meeting on Thermal Manikins. EMPA, Switzerland, pp 1 4 McCullough EA, Kenney WL (2003) Thermal insulation and evaporativeresistance of football uniforms. Med Sci Sports Exercise 35: McCullough EA, Jones BW, Tamura T (1989) A data base for determining the evaporative resistance of clothing. ASHRAE Trans 95: Nilsson H (2004) Comfort climate evaluation with thermal manikin methods and computer simulation models. PhD dissertation, Royal Institute of Technology, Stockholm Parsons KC (2003) Human thermal environments: the effects of hot, moderate and cold environments on human health, comfort and performance. Taylor & Francis, London Richards MGM, McCullough EA (2005) Revised Interlaboratory study of sweating thermal manikins including results from the sweating agile thermal manikin. J ASTM Int 2:1 13. doi: /jai12109 Ross KA (2005) Evaluation of an instrumented sweating manikin for predicting heat stress in firefighters turnout ensembles. Master dissertation, North Carolina State University, NC Wang F, Gao C, Kuklane K, Holmér I (2009) A study on evaporative resistances of two skins design for thermal manikin Tore under different environmental conditions. J Fiber Bioeng Inform 1: doi: /jfbi Wang F, Kuklane K, Gao C, Holmér I (2010) The development and validation of empirical equations to predict sweating skin surface temperature for thermal manikins. J Therm Biol 35: doi: /j.jtherbio
100 Paper II
101

102 ARTICLE IN PRESS Journal of Thermal Biology 35 (2010) Contents lists available at ScienceDirect Journal of Thermal Biology journal homepage: Development and validity of a universal empirical equation to predict skin surface temperature on thermal manikins Faming Wang n, Kalev Kuklane, Chuansi Gao, Ingvar Holmér Thermal Environment Laboratory, Division of Ergonomics and Aerosol Technology, Department of Design Sciences, Faculty of Engineering, P.O. Box 118, Lund University, Sölvegatan 26C, Lund , Sweden article info Article history: Received 30 January 2010 Accepted 31 March 2010 Keywords: Skin temperature Empirical equation Heat loss Clothing ensemble Thermal manikin abstract Clothing evaporative resistance is an important input in thermal comfort models. Thermal manikin tests give the most accurate and reliable evaporative resistance values for clothing. The calculation methods of clothing evaporative resistance require the sweating skin surface temperature (i.e., options 1 and 2). However, prevailing calculation methods of clothing evaporative resistance (i.e., options 3 and 4) are based on the controlled nude manikin surface temperature due to the sensory measurement difficulty. In order to overcome the difficulty of attaching temperature sensors to the wet skin surface and to enhance the calculation accuracy on evaporative resistance, we conducted an intensive skin study on a thermal manikin Tore. The relationship among the nude manikin surface temperature, the total heat loss and the wet skin surface temperature in three ambient conditions was investigated. A universal empirical equation to predict the wet skin surface temperature of a sweating thermal manikin was developed and validated on the manikin dressed in six different clothing ensembles. The skin surface temperature prediction equation in an ambient temperature range between 25.0 and C is Tsk¼ HL. It is demonstrated that the universal empirical equation is a good alternative to predicting the wet skin surface temperature and facilitates calculating the evaporative resistance of permeable clothing ensembles. Further studies on the validation of the empirical equation on different thermal manikins are needed however. & 2010 Elsevier Ltd. All rights reserved. 1. Introduction Skin is the largest external organ of the human body. It consists of several layers and protects the human body when the environmental temperature is within the normal physiological range (Xu et al., 2008). Skin surface temperature is one of the most important parameters in heat exchanges between the human body and its environment. The level of skin surface temperature affects the heat and mass transfer by convection, radiation and evaporation (Mairiaux et al., 1987). Therefore, skin temperature plays a fundamental role in thermoregulation (Lichtenbelt et al., 2006). The prediction of skin surface temperature is very important for the human heat balance. Similar to human beings, the skin surface temperature of a sweating thermal manikin directly determines the clothing evaporative resistance, one of the most important parameters used in thermal comfort models. Thermal manikins have served research and development purposes for about 70 years (Holmér, 2004). It is well known that thermal manikins are one of the most ideal instruments for n Corresponding author. Tel.: ; fax: address: faming.wang@design.lth.se (F. Wang). measuring the thermal insulation and evaporative resistance of clothing ensembles. The calculations of clothing thermal insulation and evaporative resistance require the skin surface temperature (EN ISO 15831, 2004; ASTM F 2370, 2005). Currently, there is only one reported thermal manikin can measure the clothing thermal insulation and evaporative resistance in one step (Fan and Chen, 2002). Most of the other thermal manikins require two steps to determine clothing evaporative resistance under non-isothermal conditions, a dry test and a wet test (Wyon, 1989; Richards and Mattle, 2002; Wang, 2008; Celcar and Meinander, 2008). For dry tests to determine clothing thermal insulation, a dry heated thermal manikin can be used to achieve this. However, to measure clothing evaporative resistance, a wet test is needed, and an additional fabric skin should be put on top of the dry heated thermal manikin to simulate sweating. As it is the manikin s nude surface temperature that is controlled, and not the wet fabric skin, the evaporation cooling of the wet skin layer may generate a big temperature difference between the wet fabric skin surface and the controlled nude manikin surface. It is anticipated that this temperature difference is related to the total heat loss of the manikin in non-isothermal conditions (in isothermal conditions, the evaporative heat loss theoretically equals to the total heat loss, the dry heat loss might exist due to the temperature differences among the skin surface, manikin and /$ - see front matter & 2010 Elsevier Ltd. All rights reserved. doi: /j.jtherbio

103 ARTICLE IN PRESS 198 F. Wang et al. / Journal of Thermal Biology 35 (2010) the environment). To some extent, the accuracy of measurement of the wet skin fabric surface temperature determines the calculation accuracy of clothing evaporative resistance. However, no data have been published on putting temperature sensors on the wet skin surface to measure the actual skin surface temperature under a wide range of environmental conditions. Informally, various laboratories have reported attempts at this using surface sensors (Redortier, Havenith, Ueno, Kuklane, Burke; personal communications at ICEE, 2007), but with limited success. Havenith (personal communication, 2008) studied this phenomenon using an infrared camera and developed some prediction equations, though this was not published either. In a recent skin study (Wang et al., 2010), we developed and validated an empirical equation to predict the skin surface temperature in an isothermal condition (t manikin ¼t a ¼t radiant ¼34 1C) based on the total heat loss and the nude manikin surface temperature. However, the empirical equation should be extended to a wide range of ambient temperatures in order to get more applications. Thus, it was deemed more useful to perform a study to measure wet skin surface temperatures and develop a universal skin temperature prediction equation relating the wet fabric skin temperature to the nude manikin surface temperature and the total heat loss. Ideally, with such a skin equation, we could predict the wet skin surface temperature without even using temperature sensors, avoiding a lot of technical issues. In addition, such a skin temperature prediction equation could also be expected to predict the skin surface temperature for the wet skin with clothing ensembles worn on the top. Finally, the predicted wet fabric skin temperature could be used to calculate the clothing evaporative resistance. In this paper, a well-fitted knit cotton fabric skin was placed on top of a dry heated thermal manikin Tore to simulate a skin wetted by sweating. The wet skin inner surface temperatures and outer surface temperatures were pre-measured on an undressed manikin by totally 18 temperature sensors at 34.0 and C. The temperature differences between the skin inner and outer surfaces were statistically compared and a suitable sensor attachment method was chosen for the tests conducted in the equation development and validation parts. A universal skin temperature empirical equation was developed based on the observed skin temperature, nude manikin surface temperature and the total heat loss at three different ambient temperatures: 34.0, 30.0 and C. Moreover, the empirical equation for skin surface temperature prediction was validated on the manikin while this was dressed in 6 different clothing ensembles. The calculated evaporative resistances of 6 clothing ensembles by 2 options (as shown later by options 2 and 4) were compared in order to check the practicability of the universal empirical equation. Finally, further studies on how to extend the application of the prediction equation to different types of thermal manikins were discussed. 2. Methods 2.1. Thermal manikin A Swedish 17 segments thermal manikin Tore was used in this study (Fig. 1). Tore is made of plastic foam with a metal frame inside to support body parts and for joints (Kuklane et al., 2006). It is the size of an average Swedish male of 1980s. Its height is 170 cm, chest and waist circumferences are 94 and 88 cm, respectively, with a total heated body area of m 2. The wire temperature sensors used for measuring nude manikin surface temperatures were evenly embedded on each area. The manikin surface temperature can be independently controlled, and the total heat input required to achieve this was recorded by a specially designed computer program. The heat input is a direct measure of the heat loss from the manikin (Wang, 2008; Havenith et al., 2008). The entire thermal manikin was placed in a climatic chamber, where various ambient conditions can be simulated Skin layer Fig. 1. The thermal manikin Tore in the climatic chamber. A knit cotton fabric skin (fabric mass per unit area: 228 g/m 2 ) was used in this study. The skin was specially designed for the thermal manikin Tore and fits it tight. Before each wet test, the cotton skin was rinsed in a washing machine (Electrolux W3015H, Sweden) for 4 min and then centrifuged 4 s to ensure water would not drip from the skin Temperature sensor The CMOS type temperature sensors (Pin SHT75, Sensirion AG, Switzerland) were used to record the skin surface temperature values. The temperature accuracy is C. The size of a sensor is mm 3 (length width thickness). The temperature sensor and attachment are presented in Fig. 2. As to the thermistor point was faced to the skin inner surface side, the observed temperature values come from the wet skin inner surface rather than the nude manikin surface Test conditions The skin tests presented in this paper consisted of three parts: the skin temperature comparison tests to determine the sensor attachment (on the skin surface or under the skin surface, totally
.")
104 ARTICLE IN PRESS F. Wang et al. / Journal of Thermal Biology 35 (2010) Fig. 2. The CMOS temperature sensor and a sensor attachment to the nude manikin surface. Table 1 Test conditions (equation development and validation sections). Temperature Equation development part Equation validation part t a (1C) RH (%) P a (kpa) v a (m/s) RH (%) P a (kpa) v a (m/s) tests), development tests of skin temperature prediction equations (18 tests) and validation tests on skin temperature prediction equations (16 tests). The nude thermal manikin surface temperature was set to C for all 38 tests. Three platinum air temperature sensors set at the height of 0.1, 1.1 and 1.7 m were used to record the ambient temperatures. The air inlets in the climatic chamber are from the mesh ceiling and air outlets are through the lower mesh part of one side wall. The skin temperature comparison tests were performed at two ambient temperatures, C, 40% RH and C, 45% RH. The air velocity was controlled at m/s. In the temperature comparison part, 18 digital temperature sensors were used to record the skin inner and outer surface temperatures. Twelve sensors were attached to the nude manikin surface at 12 positions (the left upper arm, left lower arm, right lower arm, right upper arm, right scapula, right lower chest, left upper chest, left lower buttocks, right shin, left calf, right posterior thigh and the left anterior thigh) using waterproof surgical tapes (3M, USA). Other six sensors were attached to the wet skin outer surface at 6 sites (the left anterior thigh, left upper chest, left lower buttock, right upper arm, right lower arm and the right upper back) using white thread rings (Resårband Gummilitze Elastic Braid, Sweden). The equation development and validation tests were conducted at three environmental conditions, where the ambient temperatures were 34.0, 30.0 and C, respectively. The RHs and partial water vapour pressures in the climatic chamber at these three temperatures are listed in Table 1. In the equation development and validation sections, 12 sensors were used to measure the skin inner surface temperatures. Furthermore, six different working clothing ensembles were selected to validate the empirical equation. The details of all 6 clothing ensembles are displayed in Table 2. In the equation validation section, it was assumed that the RH on the wet skin surface was 100%. Eight thermal manikin validation tests in clothing ensembles L, HV, MIL and CLM were conducted at C and 46.4% RH. Other 8 validation measurements in two permeable and impermeable overalls were conducted at two environmental conditions: C, 63.2% RH and C, 67.4% RH. The air velocity for all 16 validation tests was controlled to m/s. Finally, the calculated total evaporative resistances of all 6 clothing ensembles by two calculation options (as shown later by options 2 and 4) were presented and compared Calculation of clothing evaporative resistance ASTM F 2370 (2005) specifies the following two options to calculate the clothing evaporative resistance: Option 1 : R et ¼ ðp sk p aþa H e ¼ ½ðe18:956 ð4030:18=t sk þ 235Þ ÞRH sk ðe 18:956 ð4030:18=ta þ 235Þ ÞRH aša H e Option 2 : R et ¼ ðp sk p aþa lðdm=dtþ ¼ ½ðe18:956 ð4030:18=t sk þ 235Þ ÞRH sk ðe 18:956 ð4030:18=ta þ 235Þ ÞRH aša lðdm=dtþ where, R et is the total evaporative resistance of clothing ensemble, kpa m 2 /W; p sk and p a are the saturated and partial water vapour pressures at the manikin sweating skin surface and the environment, respectively, kpa; A is the area of manikin s surface that is sweating, m 2, for thermal manikin Tore, A¼ m 2 ; H e is the evaporative heat loss from the manikin, W; t sk and t a are the sweating skin surface temperature and the air temperature, respectively, 1C; RH sk and RH a are the relative humidities of the sweating skin surface and in the air, respectively, %; l is the heat of vaporization of water at the measured skin surface temperature, W; dm/dt is the evaporation rate of moisture leaving the manikin s sweating surface, kg/h. Due to the difficulty of attaching sensors on the sweating skin surface and the limited sensory technology, the prevailing methods to calculate clothing evaporative resistance are Option 3 : R et ¼ ðp sk p aþa H e ¼ ½ðe18:956 ð4030:18=t manikin þ 235Þ ÞRH sk ðe 18:956 ð4030:18=ta þ 235Þ ÞRH aša H e
105 ARTICLE IN PRESS 200 F. Wang et al. / Journal of Thermal Biology 35 (2010) Table 2 Details of six clothing ensembles (the equation validation section). Code Garment components W (g) It (1Cm 2 /W) L T-shirt, briefs, short pants, socks, sports shoes HV T-shirt, briefs, long trousers with 3 M s reflective materials, socks, sports shoes MIL Jacket, long trousers, net t-shirt, briefs, socks, sports shoes CLM Polyamide overall laminated with Gore-tex s membrane, t-shirt, briefs, socks, sports shoes PERM Permeable overall (hydrophobic layer laminated with inner PTFE membrane) a IMP Impermeable overall (PA webbing coated with PVC) a Note: L: light series clothing; HV: high vision series clothing; MIL: military series clothing; CLM: climber series clothing; IMP, impermeable; PERM, permeable. W: total weight of the clothing ensemble; It: thermal resistance of clothing ensemble or fabric material. a The data come from the fabric material, which are measured on a sweating hot plate according to ISO (Havenith et al., 2008). Option 4 : R et ¼ ðp sk p aþa lðdm=dtþ ¼ ½ðe18:956 ð4030:18=t manikin þ 235Þ ÞRH sk ðe 18:956 ð4030:18=ta þ 235Þ ÞRH aša lðdm=dtþ where t manikin is the temperature on the nude thermal manikin surface, 1C. For the thermal manikin Tore, it is the paint layer surface temperature. There are a resin covering heating wires, a copper layer and a paint layer on top of the plastic foam. 3. Results and discussion 3.1. Determination of temperature sensor attachment The attachment of temperature sensors using thread rings to the wet skin outer surface was difficult and time consuming. The sensors should be attached to the skin outer surface before each test and removed after the test. On the other hand, the distance to the skin surface greatly affects the temperature values. Besides, the impermeable sticky tapes cannot be applied on the wet surface as they might restrict the evaporation and may malfunction when attached to the wet flat surface. It is also difficult to determine standard measurement points on the fabric skin surface for each separate test. An alternative to solve these problems is that all the sensors were attached on the nude manikin surface to measure the wet skin inner surface temperature. If no significant temperature differences were observed, then the measurement of the wet skin inner surface temperatures could be performed instead to replace its outer surface temperatures. For these reasons, we conducted a temperature precomparison study before the development of the skin empirical equations. Considering the temperature difference between inner and outer surfaces might be bigger at a low ambient temperature, we conducted 4 tests at both 34.0 and C. The main aims of the current study were to simplify the measurement and save the preparation time as the wet skin will dry out after min. The comparison can also improve the measurement accuracy by keeping sensors in standard positions processed to the skin. In addition, the temperature data could be used to calculate the water vapour pressure on the skin surface, and the evaporative resistance of clothing ensembles could be determined accordingly. The mean skin inner and outer surface temperatures were calculated based on each 3-min data during the stable state period of each test condition. The total sample size was 32. The paired-samples t-test was performed using SPSS (v.16.0, Chicago, IL, USA) to determine whether there are significant mean temperature differences between the skin inner surface and outer surface. The significant level was set at 0.05 and the P value [i.e., Sig (2-tailed)] was Therefore, the null hypothesis should be accepted accordingly, i.e., there were no significant temperature differences between the wet skin inner surface and outer surface. Therefore, the temperatures measured on the skin inner surface can be deemed as values measured on the skin outer surface. This simplifies the measurement and most important, the measurement accuracy is the same Development of equations to predict wet skin surface temperature A special MS-DOS program (Nilsson, 2004) was used to record the total heat loss from the undressed manikin (only with the wet fabric skin). The temperatures and relative humidities of the wet skin inner surface were recorded every 10 s by the Sensirion program (Sensirion AG, Switzerland). The tests were performed twice at each test condition. The test stopped when an obvious decrease in the heat loss from the thermal manikin was observed. The data selected from the stable state of the test period were used for analysis. Based on the data of the thermal nude manikin surface temperature, wet fabric skin surface temperature and the total heat loss, a scatter chart with markers was plotted at each testing temperature. Considering the fact that the skin surfaces will not cool down if there is no evaporative heat loss, a linear regression equation with a forced point (0, t manikin ) was developed accordingly. The averaged nude manikin surface temperatures t manikin was C. Hence, it is evident that the heating power provided for the thermal manikin Tore could maintain the desired manikin surface temperature (i.e., C) at ambient temperatures ranged from 34.0 to C. It can be deduced from Fig. 3 that the linear equation fits all 18 scatters well and the correlation factor R is The universal skin temperature prediction equation developed at an environmental temperature range between 25.0 and C is defined as T sk ¼ 34:00 0:0132HL ð1þ where T sk is the mean skin surface temperature, 1C; HL is the total sweating area heat loss from the thermal manikin, W/m 2. Moreover, Havenith (personal communication, 2008) analysed wet skin surface temperatures of a thermal manikin Newton (Havenith et al., 2008) by a thermal infrared camera immediately after stripping clothing. The skin temperature prediction equation on the thermal manikin Newton at an ambient temperatures C was T sk ¼ 34:13 0:012HL ð2þ 3.3. Validity of skin temperature prediction equations Two overalls and 4 working clothing ensembles were used in this section for the validation of the skin temperature prediction equations. The observed and predicted wet skin surface temperatures for each clothing ensemble at three different ambient temperatures were plotted in Fig. 4.
 197 203 201 Table 3 The calculated RMSD values for four prediction equations in each 16 test conditions (the equation validation section). Eq. (1) Eq. (2) L 0.")
106 ARTICLE IN PRESS F. Wang et al. / Journal of Thermal Biology 35 (2010) Table 3 The calculated RMSD values for four prediction equations in each 16 test conditions (the equation validation section). Eq. (1) Eq. (2) L Average mean SD HV Average mean SD MIL Average mean SD CLM Average mean SD PERM Average mean SD IMP Average mean SD Fig. 3. The universal empirical equation for prediction of the wet skin surface temperature at an ambient temperature range between 25.0 and C (equation development part). Fig. 4. Predicted and observed skin surface temperatures for 6 clothing ensembles (equation validation part). t sk, the observed skin surface temperature; t sk_p1, the predicted skin surface temperature by Eq. (1); t sk_p2, the predicted skin surface temperature by Eq. (2). The root mean squared deviation (RMSD) was used to compare the statistical evaluation between the predicted values and observed data. The RMSD is a frequently used measure of differences between values predicted by a model and the values actually observed from the thing being modelled or estimated (Castellani et al., 2007). The best prediction value is that which gives the minimal RMSD. The RMSD is defined as sffiffiffiffiffiffiffiffiffiffiffiffiffiffiffiffiffiffiffiffi P n i ¼ 1 RMSD ¼ x i 2 ð3þ n where x i is the difference between the predicted and observed at each test condition; n is the number of comparisons. The heat loss values observed from the thermal manikin Tore during the stable state of the 12 validation tests ranged from 25.1 to W/m 2. The RMSD values of those two empirical equations at each test are displayed in Table 3. Table 3 also presents the averaged standard deviation from the observed mean skin surface temperature over the time of each 16 test conditions. This provides the capability to examine the prediction accuracy of these two prediction equations. For the empirical Eq. (1), the RMSD values in all 6 clothing ensembles ranged from 1.54 to 8.32 times greater than the mean standard deviation. For Eq. (2), the RMSD values ranged from 0.69 to 17.0 times greater than the mean standard deviation. In general, the predicted temperature values from any model are more than two times greater than the mean standard deviation of the observed data which indicates that the prediction of the model fall outside of the 95% of an average population (Cadarette et al., 1999). The six test conditions with the most favourable comparisons between observed data and the estimated values with Eqs. (1) and (2) occurred in HV and IMP. However, the predicted values in other 4 test clothing ensembles from Eqs. (1) and (2) are 3.72 to 17.0 times greater than the mean standard deviation. From a statistical point of view, the prediction values by these two equations in clothing ensembles L, MIL, CLM and PERM are not accurate enough. In the real situation, considering the skin temperature values were recorded with a precision of C, agreement of predicted value with the observed data to this precision level would always be the acceptance accuracy. However, lesser level such as C of precision will also be useful. The predicted skin temperatures by Eq. (1) in L, HV and IMP were 0.10, 0.31 and C greater than the observed values, while the predicted data in clothing ensembles MIL, CLM and PERM were 0.23, 0.17 and C lesser than the observed data. All predicted values by Eq. (1) are well within acceptable levels. Similarly, the predicted skin temperatures by Eq. (2) in all clothing ensembles except HV were ranged C lesser than the observed temperatures. For clothing ensemble HV, the predicted temperature value was C greater than measured skin temperature. Thus, the developed empirical equation from another type of the thermal manikin could predict the wet skin temperatures within the C precision level. It should also be noted that Eq. (2) was developed based on only one ambient temperature (i.e., C). Higher accuracy on the predicted values is expected if the empirical equation could be developed based on a wide range of environmental conditions. The total evaporative resistances of all 6 clothing ensembles calculated by options 2 and 4 are described in Fig. 5. The calculated clothing evaporative resistances by option 2 were ranged from 21.3 to Pa m 2 /W. It is evident that the prevailing calculation method (i.e., option 4) produces greater values than the data calculated from the standard option listed in ASTM F2370 (i.e., option 2). In addition, the calculated mean evaporative resistances of all 6 clothing ensembles based on the predicted skin surface temperatures by Eqs. (1) and (2) are relatively good. Therefore, the accuracy of clothing evaporative resistance is highly enhanced by these two empirical equations.

107 ARTICLE IN PRESS 202 F. Wang et al. / Journal of Thermal Biology 35 (2010) Fig. 5. The clothing evaporative resistances of 6 clothing ensembles calculated based on 4 different temperatures. Ret_m, the calculated evaporative resistance based on the prevailing method, i.e., option 4; R et-sk, the calculated evaporative resistance by option 2; R et_p1, the calculated evaporative resistance based on the predicted skin temperature by Eq. (1); R et_p2, the calculated evaporative resistance based on the predicted skin temperature by Eq. (2). In this study, a universal empirical equation for the prediction of sweating fabric skin surface temperature on a thermal manikin was developed and validated. It should be noted that the empirical equation was obtained from a specific thermal manikin. The prediction equations developed from different thermal manikins may be slightly different due to different data analysis and operation methods. Further interlaboratory studies will be performed on different thermal manikins by using the same temperature measurement technology and test protocol. In addition, the effect of wicking and condensation inside multilayer clothing ensembles should be examined in order to enhance the prediction accuracy. A correction for the empirical equation might be needed at some specific test scenarios. Acknowledgements The authors would like to thank Professor George Havenith in the Environmental Ergonomics Research Centre, Loughborough University, UK, who shared his empirical equations to us and also made many valuable comments on the manuscript. We thank Dr. Peter Bröde in Leibniz Research Centre for Working Environment and Human Factors at Dortmund, Germany, who listed many good suggestions on the statistical analysis. We are also grateful to the two anonymous reviewers for their valuable comments on an early draft version. This study was financially supported by China Scholarship Council and Taiga AB in Varberg, Sweden. 4. Conclusions We developed a universal empirical equation for the prediction of wet fabric skin surface temperature of a thermal manikin Tore in an ambient temperature range between 25.0 and C. The empirical equation was validated on 6 clothing ensembles under three different environmental conditions. It is evident from the acceptable precision levels that the empirical equation is a good alternative to predict the wet skin surface temperature for the thermal manikin dressed in various clothing ensembles. The empirical equation for prediction of sweating skin surface temperatures is T sk ¼ HL. In this paper, we only validated the universal empirical equation on a specific thermal manikin. The empirical equation obtained from another thermal manikin showed a slightly low precision on the predicted skin temperature values. Future validation studies should therefore focus on other thermal manikins, such as the sweating thermal manikin Newton, and possibly on other types of fabric skins and extensions in wider ambient temperature ranges. Meanwhile, a further investigation might be needed to examine the effects of wicking and condensation on the predicted skin temperature at low ambient temperatures inside multi-layer clothing ensembles. References ASTM F 2370, Standard Test Method for Measuring the Evaporative Resistance of Clothing Using a Sweating Manikin. American Society for Testing and Materials, USA. Cadarette, B., Montain, S., Kolka, M., Stroschein, L., Matthew, W., Sawka, M., Cross validation of USARIEM heat strain prediction models. Aviat. Space Environ. Med. 70, Castellani, J., Brien, C., Tikuisis, P., Sils, I., Xu, X., Evaluation of two cold thermoregulatory models for prediction of core temperature during excise in cold water. J. Appl. Physiol. 103, Celcar, D., Meinander, H., Heat and moisture transmission properties of clothing systems evaluated by using a sweating thermal manikin under different environmental conditions. Int. J. Cloth. Sci. Technol. 20, EN ISO 15831, Clothing Physiological Effects Measurement of Thermal Insulation by Means of a Thermal Manikin. European Committee for Standardization, Brussels. Fan, J., Chen, Y., Measurement of clothing thermal insulation and moisture vapour resistance using a novel perspiring fabric thermal manikin. Meas. Sci. Technol. 13, Havenith, G., Richards, M., Wang, X., Bröde, P., Candas, V., Hartog, E., Holmér, I., Kuklane, K., Meinander, H., Nocker, W., Apparent latent heat of evaporation from clothing: attenuation and heat pipe effects. J. Appl. Physiol. 104, Holmér, I., Thermal manikin history and applications. Eur. J. Appl. Physiol. 92, Kuklane, K., Heidmets, S., Johansson, T., Improving thermal comfort in an orthopaedic aid: better Boston brace for scoliosis patients. In: Fan, J. (Ed.), The 6th International Meeting on Thermal Manikin and Modelling (6I3M). The Hong Kong Polytechnic University, Hong Kong, pp
108 ARTICLE IN PRESS F. Wang et al. / Journal of Thermal Biology 35 (2010) Lichtenbelt, W., Daanen, H., Wouters, L., Fronczek, R., Raymann, R., Severens, N., Van, S., Evaluation of wireless determination of skin temperature using ibuttons. Physiol. Behav. 88, Mairiaux, P., Malchaire, J., Candas, V., Prediction of mean skin temperature in warm environments. Eur. J. Appl. Physiol. 56, Nilsson H., Comfort climate evaluation with thermal manikin methods and computer simulation models. Ph.D. Thesis, Royal Institute of Technology. Accessed on March 22, Available from / handle/2077/4340s. Richards, M., Mattle, N., A sweating thermal manikin (SAM) developed to test complete clothing systems under normal and extreme conditions. In: RTO HFM Symposium, Blowing Hot and Cold: Protecting Against Climatic Extremes, 4, pp Wang, F., A comparative introduction on sweating thermal manikins Newton and Walter. In: Silva, M.C.G. (Ed.), The 7th International Meeting on Thermal Manikin and Modelling (7I3M). University of Coimbra, Portugal, pp Wang, F., Kuklane, K., Gao, C., Holmér, I., Havenith, G., Development and validation of an empirical equation to predict sweating skin surface temperature for thermal manikins. In: Li Y (Ed.), The 3rd International Symposium on Textile Bioengineering and Informatics (TBIS), Shanghai, China, pp Wyon, D., Use of thermal manikins in environmental ergonomics. Scand. J. Work Environ. Health 15 (Suppl 1), Xu, F., Lu, T.J., Seffen, K.A., Skin thermal pain modelling a holistic method. J. Therm. Biol. 33,
109
110 Paper III
111
112 Ann. Occup. Hyg., Vol. 55, No. 7, pp , 2011 Ó The Author Published by Oxford University Press on behalf of the British Occupational Hygiene Society doi: /annhyg/mer034 Determination of Clothing Evaporative Resistance on a Sweating Thermal Manikin in an Isothermal Condition: Heat Loss Method or Mass Loss Method? FAMING WANG*, CHUANSI GAO, KALEV KUKLANE and INGVAR HOLMÉR Thermal Environment Laboratory, Division of Ergonomics and Aerosol Technology, Department of Design Sciences, Faculty of Engineering, Lund University, SE Lund, Sweden Received 5 January 2011; in final form 2 April 2011; published online 13 June 2011 This paper addresses selection between two calculation options, i.e heat loss option and mass loss option, for thermal manikin measurements on clothing evaporative resistance conducted in an isothermal condition (T manikin 5 T a 5 T r ). Five vocational clothing ensembles with a thermal insulation range of clo were selected and measured on a sweating thermal manikin Tore. The reasons why the isothermal heat loss method generates a higher evaporative resistance than that of the mass loss method were thoroughly investigated. In addition, an indirect approach was applied to determine the amount of evaporative heat energy taken from the environment. It was found that clothing evaporative resistance values by the heat loss option were % greater than those based on the mass loss option. The percentage of evaporative heat loss taken from the environment (H e,env ) for all test scenarios ranged from 10.9 to 23.8%. The real evaporative cooling efficiency ranged from to 0.891, respectively. Furthermore, it is evident that the evaporative heat loss difference introduced by those two options was equal to the heat energy taken from the environment. In order to eliminate the combined effects of dry heat transfer, condensation, and heat pipe on clothing evaporative resistance, it is suggested that manikin measurements on the determination of clothing evaporative resistance should be performed in an isothermal condition. Moreover, the mass loss method should be applied to calculate clothing evaporative resistance. The isothermal heat loss method would appear to overestimate heat stress and thus should be corrected before use. Keywords: ASTM F2370; evaporative cooling efficiency; evaporative resistance; heat stress; isothermal; thermal manikin INTRODUCTION Clothing acts as a moisture barrier between the wearer s body and environment (Havenith et al., 1999). With regard to heat stress, one of the most important physical parameters is its evaporative resistance (Bernard and Matheen, 1999; Fan and Chen, 2002; Holmér, 2006; Caravello et al., 2008). The clothing evaporative resistance determines the amount of sweat evaporation from the wearer s body to the surrounding environment *Author to whom correspondence should be addressed. Tel: þ ; fax: þ ; faming.wang@design.lth.se (Caravello, 2004). For any type of clothing ensemble, a low evaporative resistance value is always preferredtoahighvalue(wang, 2010). On the other hand, clothing evaporative resistance is needed in both heat strain prediction and thermoregulatory models (Kolka et al., 1994; Gonzalez et al., 1997; Gallagher, 2009). Such mathematical modelling could provide invaluable data on the development of body core temperature and thermophysiological duration limited exposure for industrial and occupational hygienists (Malchaire et al., 2000; Besnard et al., 2004; Cain, 2006). Previous studies have demonstrated that inter- and intra-laboratory measurements of clothing thermal 775
113 776 F. Wang et al. insulation on various dry heated thermal manikins are highly reproducible (Anttonen et al., 2004; Kuklane et al., 2005; Gao et al., 2006). However, laboratory tests on the determination of clothing evaporative resistance showed a great variation among different types of sweating thermal manikins (McCullough, 2001; Richards and McCullough, 2005). Some possible reasons to account for the big discrepancy may include different sweating simulation methods, limited controlling capacity of climatic chambers, different manikin configurations, differences in detailed testing protocols, and calculation options (Richards and McCullough, 2005; Huang, 2007; Havenith et al., 2008b; Wang et al., 2010a,b). ASTM F2370 (2010) is the only published standard describing the determination of clothing evaporative resistance using a sweating thermal manikin. In this standard, two calculation options are provided: heat loss method (i.e. Option 1) and mass loss method (i.e. Option 2). Both methods require the water vapour pressure gradient between the sweating skin and ambient environment. The heat loss method uses the area-weighted real evaporative heat loss observed from the sweating thermal manikin to calculate evaporative resistance. The mass loss method calculates the mass loss rate first and then converts it to the evaporative heat loss by multiplying the latent heat of vapourization of water. Very little investigative work has been published concerning the effect of different calculation methods on clothing evaporative resistance. Havenith et al. (2008a) pointed out that the isothermal heat loss method underestimated the evaporative heat loss. Thus, the evaporative resistance generated by this method was higher than the clothing evaporative resistance acquired by the mass loss option in the isothermal condition. If this value were used as an input in a heat strain/thermoregulatory model, the heat stress was overestimated (Havenith et al., 2008a). However, up to now, the evaporative heat loss difference introduced by those two methods has not yet been thoroughly investigated. The reasons behind this evaporative heat loss difference in isothermal condition have not been discussed either. In this paper, the clothing evaporative resistances calculated by two calculation options were compared and analysed. The amount of evaporative heat energy difference introduced by the heat loss method and by the mass loss rate was verified by thermal manikin measurements. Moreover, the percentages of evaporation heat taken from the manikin body and the ambient environment were calculated. Some suggestions on how to choose between those two calculation methods were finally discussed. METHODS Calculation of evaporative resistance In an isothermal condition, there is no dry heat exchange (i.e. conductive, convective, and radiative heat losses are equal to zero) between the manikin surface and the environment because T manikin 5 T a 5 T r (the air temperature T a equals to the manikin temperature T manikin andbothvaluesequaltothe radiant temperature T r ). Also, theoretically, condensation inside clothing will never take place. Therefore, the isothermal condition is the most preferable condition for measuring clothing evaporative resistance (Havenith et al., 2008b; ASTM F2370, 2010). In such a condition, the clothing evaporative resistance could be calculated by isothermal heat loss method or mass loss method (ASTM F2370, 2010). R et;heat 5 Dp iso A H e;heat ; ð1þ R et;mass 5 Dp iso A 5 Dp iso A H e;mass k dm ; ð2þ dt where R et,heat is the total clothing evaporative resistance calculated by the heat loss method, kilopascal square metres per watt; Dp iso is the water vapour pressure gradient between the wet/sweating textile skin surface and in the environment at the isothermal condition, kilopascal; A is the sweating surface area, square metre; in this study, the pre-wetted skin s surface area was assumed to be equal to the manikinsurfaceareabecausetheskinisprettythin and it fits tightly around the manikin body shape, A m 2. H e,heat is the real evaporative heat loss observed from the sweating thermal manikin, watt; R et,mass is the total clothing evaporative resistance calculated by the mass loss method, kilopascal square metres per watt; H e,mass is the calculated evaporative heat loss from the mass loss rate, watt; k is the heat of vaporization of water at the measured skin temperature, watt hours per gram; in this study, k Wh g 1 at 34.0 C; the ratio of dm/dt is the evaporation rate of moisture from the wet textile skin leaving the manikinclothing system, grams per hour. Since there was an evaporative heat loss difference between those two calculation methods (Havenith et al., 2008a; Wang et al., 2009), the amount of heat energy required for water evaporation should both come from the thermal manikin and from its environment. Otherwise, no evaporative heat loss difference could be observed.
114 Determination of clothing evaporative resistance on a thermal manikin 777 Apparently, the observed real evaporative heat energy H e,heat from the manikin body is a part of the total heat energy used for sweat evaporation. Thus, the following formula is valid H e;mass.h e;heat : ð3þ With equations (1) and (2) and formula (3), we can easily find R et;heat.r et;mass : ð4þ The amount of heat energy H e,mass calculated from the mass loss rate of the manikin-clothing system could also be expressed as H e;mass 5 H e;heat þ H e;env ; ð5þ where H e,env is the amount of evaporative heat energy taken from the environment. Determination of H e,env With current technology, it is difficult to determine H e,env by the thermal manikin testing in one step. This is probably because there is no feasible approach that could force the wet textile skin to absorb heat from only the environment at an isothermal condition. Even if there is a feasible method that could make the wet skin to absorb heat from the environment only, the skin temperature will not be the same as that in the isothermal condition. The pre-wetted textile skin temperature is dependent on both the manikin surface temperature and the whole manikin-clothing system s evaporation rate (Wang et al., 2010b). In order to determine the amount of evaporative heat taken from the environment H e,env, an indirect method was applied. The manikin was placed in a climatic chamber but not heated. The pre-wetted textile fabric skin was dressed on the manikin surface. An equilibrium condition will be reached when the following two conditions are observed (ASTM F2370, 2010): 1. the manikin surface temperature T manikin remains constant ( 3%) and 2. the wet textile skin temperature T sk reached stable and it varies within 1.0 C. It is anticipated that the manikin surface temperature is lower than the pre-wetted textile skin surface temperature. Therefore, the heat energy required for sweat evaporation comes purely from the ambient. The mass loss rate of the manikin-clothing system could be determined by weighing. Then, the amount of evaporative heat energy H9 e,env at such a condition may be determined by the equation (6): He;env 9 5 k dm dt ; no;heat ð6þ where H9 e,env is the heat energy taken from the environment when the manikin is not heated at an ambient temperature of 34.0 C, watt; dm dt no;heat is the mass loss rate of the pre-wetted textile skin when the manikin is not heated, grams per hour. It should be also noted that the water vapour pressure gradient at the above test condition is different with that in the isothermal condition (i.e. the manikin is heated and the air temperature is kept the same). Therefore, this mass loss rate is not equal to that at the isothermal condition. However, it could be derived from a method described below. Kucera (1954) investigated the relationship of evaporation rate to the vapour pressure deficit and low wind velocity and found that the relationship between the evaporation rate and the vapour pressure deficit appears to be linear. Brebner et al. (1956) studied the diffusion of water vapour through the human skin and found that the sweat loss rate has a linear relation with the water vapour pressure gradient between the saturated skin and the ambient. Bernard and Matheen (1999) also commented that the evaporation rate mainly depends on the water vapour pressure gradient between the human skin and ambient air. Based on these findings, the mass loss rate at a specific water vapour pressure gradient might be calculated by equation (7): dm dt 5 k Dp; ð7þ where k is a constant, which is related to the permeability of the wet textile skin (Brebner et al., 1956). Dp is the water vapour pressure gradient between the saturated wet textile skin and the environment at any specified condition, kilopascal. Thus, the amount of evaporative heat energy taken from the environment H e,env at the isothermal condition may be calculated by equation (8): H e;env 5 Dp iso Dp H9 e;env : ð8þ It can be deduced from equations (5), (6), and (8) that H e;mass 5 H e;heat þ Dp iso Dp k dm dt : ð9þ no;heat Test procedures A 17-segment dry heated thermal manikin Tore was used in this study (Kuklane et al., 2004).
115 778 F. Wang et al. A pre-wetted cotton knitted textile skin (dry/ conditioned weight per unit area: 228 g m 2 : moisture content: 163% of the initial mass) was placed on top of the thermal manikin to simulate a skin wetted by sweating. It covers in all 12 segments and excludes the manikin s head, hands, and feet. There was no moisture migration from pre-wetted skin to noncovered manikin surface areas due to the nonabsorbent surface of the manikin. The textile skin was rinsed with tap water in a washing machine (W3015H; Electrolux Inc., Sweden) for 4 min and then centrifuged 4 s to ensure no water dripped. Five sets of garments (Table 1) were selected and balanced in a climatic chamber at least 24 h before testing. The testing on clothing evaporative resistance followed the American standard ASTM F2370 (2010). The measurements of clothing evaporative resistance were performed at an isothermal condition, where the air temperature was 34.0 C. The relative humidity was controlled to 38.0%. The ambient temperature and relative humidity were measured by three digital temperature and relative humidity sensors (SHT75; Sensirion AG, Switzerland) set at heights of 0.1, 1.1, and 1.7 m. Twelve temperature sensors (SHT75; Sensirion AG) were attached on the wet textile skin surface using thread rings to measure its surface temperatures. The whole manikin system was placed on a weighing scale (KC240; Mettler-Toledo Inc., Switzerland, accuracy: 2 g). The mass loss rate of the whole system could be easily determined accordingly. The air velocity was maintained at m s 1.For testing on the determination of H9 e,env, the manikin was disconnected from the heating power supply box. The ambient conditions were kept the same as described above. RESULTS The evaporative resistances of the boundary air layer and five vocational clothing ensembles calculated by the heat loss method and mass loss method were displayed in Fig 1. As expected, the heat loss method produced greater clothing evaporative resistances than those calculated from the mass loss method. The results are in accordance with the formula (4). The evaporative resistance values for the boundary air layer, clothing ensembles L, HV, MIL, CLM, and FIRE based on the heat loss method were 37.1, , 21.5, 12.7, and 11.2% greater than those based on the mass loss option. The observed wet textile skin temperature and manikin surface temperature when the manikin was not heated for all six test scenarios are presented in Fig 2. The observed manikin surface temperature was C lower than the wet textile skin surface temperature. See the supplementary data at Annals of Occupational Hygiene online for further details on wet fabric skin temperatures when manikin was heated, wet skin surface vapour pressure and water vapour pressure gradient between wet skin and environment. In addition, the observed dew point at those six test conditions was always lower than the manikin surface temperature, which indicates that there was no condensation during the testing period. Thus, it is evident that the heat energy used for sweat evaporation H9 e,env at such a condition comes only from the environment. Consequently, the real evaporative heat energy taken from the environment at the isothermal condition could be determined by the equation (8). Table 2 presents the amount of evaporative heat losses taken from the manikin and the environment, respectively. The evaporative heat energy taken from the environment accounts for % of the total calculated evaporative heat loss. The real evaporative cooling efficiency ranged from to 0.891, respectively. On the other hand, the theoretical evaporative heat energy taken from the environment (i.e. H e,mass H e,heat ) was almost equal to the observed heat loss H e,env (the differences are 7.4, 8.2, 3.5, Table 1. Details of five vocational clothing ensembles Code Garment components I t, clo I cl, clo W a,g L Short sleeve tee-shirt, briefs, short pants, socks, sports shoes HV Short sleeve tee-shirt, briefs, long trousers with reflective materials, socks, sports shoes MIL Jacket, long trousers, net t-shirt, briefs, socks, sports shoes CLM Polyamide overall laminated with Gore-tex membrane, short sleeve tee-shirt, briefs, socks, sports shoes FIRE RB90 firefighting clothes, underwear, short sleeve tee-shirt, briefs, socks, sports shoes L, light clothing; HV, high-visibility clothing; MIL, military clothing; CLM, climber overall; FIRE, firefighting clothing; I t, total clothing thermal insulation, clo; I cl, clothing intrinsic thermal insulation, clo; W, total clothing weight, grams. a Clothing weight may vary a lot among different sizes; in this study, all garments have a unique size of large.
116 Determination of clothing evaporative resistance on a thermal manikin 779 Fig. 1. The evaporative resistances of the boundary air layer and five clothing ensembles calculated by heat loss method and mass loss method at an isothermal condition (T manikin 5 T a 5 T r C). 2.0, 0.3, and 0.6 W m 2, respectively; these may be mainly due to measurement error, for example the weighing scale s drift). Therefore, the indirect method to investigate and to quantify the amount of heat taken from environment for the evaporation from the wet textile skin in this study has been successfully validated. DISCUSSION There were three main findings in this study. Firstly, the isothermal heat loss method overestimated the heat stress, which is in line with the results presented in a previous study (Havenith et al., 2008a). Secondly, the higher thermal insulation of a clothing ensemble dressed on top of the manikin s wet textile skin, the less evaporative heat energy taken from the environment. This is mainly because the high insulation clothing prevented the wet textile skin from absorbing heat energy from the ambient environment. For instance, the firefighting clothing provides a thermal insulation of 2.58 clo, the calculated clothing evaporative resistance by heat loss method is only 11.2% greater than that based on mass loss method. On the other hand, if there was no clothing dressed on top of the pre-wetted textile skin, the difference between those two evaporative resistance values rose to 37.1%. Thirdly, Havenith et al. (2008b) proposed a new term real evaporative cooling efficiency to describe how much latent evaporative heat loss taken from the body when clothing is worn. It can be deduced from this study that the real evaporative cooling efficiency is higher if a higher insulation clothing ensemble was worn. However, the total amount of evaporation leaving the manikin-clothing system will be greatly impeded by the clothing. Therefore, the real evaporative cooling efficiency is not always necessarily high and how much sweat evaporation leaving the manikinclothing system is more important. Although there are more than 100 thermal manikins in the world, few of them can simulate sweating (Holmér, 2004). Thus, sweating thermal manikins are still rare at present. Today, the evaporative resistance is mostly determined on sweating guarded hotplates (Gibson et al., 1994; Huang, 2006). Since the sweating guarded hotplate is a flat apparatus, it does not take into consideration of garment features such as the human body shape and clothing microclimate. In addition, sweating guarded hotplates can only determine the static evaporative resistance of a piece of fabric. Therefore, the evaporative resistance value determined on such equipment may present a big discrepancy with that measured on sweating thermal manikins. For these reasons, sweating guarded hotplates might be used as a supplemental instrument for the determination of clothing evaporative resistance. Generally, the selection of evaporative resistance calculation method is constrained by the manikin s
117 780 F. Wang et al. Fig. 2. The observed wet textile skin temperature, manikin surface temperature (the manikin is not heated), and air temperature. (a) nude textile skin, (b) L (c) HV, (d) MIL, (e) CLM, (f) FIRE. Note: In some experiments (eg. c, d, e, and f), the manikin surface has an initial temperature,34.0 C due to a previous test cooled down the manikin. sweating simulation method. Currently, sweating simulation on thermal manikins might be categorized into three types (Gao and Holmér, 2006): pre-wetted textile skin dressed on a dry heated thermal manikin, manikins equipped with a water supply system and a certain number of sweating glands, and a body of water that hold by a piece of waterproof but permeable Goretex fabric. The thermal manikin Tore used in this study uses the first type of sweat simulation. It is a simplified sweating simulation but functions well (Holmér and Nilsson, 1994; Holmér, 2006). Both the heat loss method and the mass loss method can be used for
118 Determination of clothing evaporative resistance on a thermal manikin 781 Table 2. The mass loss rate, total evaporative heat loss, observed evaporative heat loss taken from the manikin and the environment, and the ratio of observed heat from the environment and total calculated evaporative heat loss Clothing ensemble dm/dtj no,heat gh 1 dm/dt gh 1 H e,mass Wm 2 H e,heat Wm 2 H9 e,env,wm 2 H e,env Wm 2 H e,env /H e,mass % Nude skin L HV MIL CLM FIRE The real evaporative cooling efficiency g real 5 1 H e,env /H e,mass, non-dimensional. the evaporative resistance calculation. The new Newton family thermal manikins are provided with the second type of sweating mechanism (Wang, 2008; Measurement Technology Northwest, 2010). For this type of sweating manikin, it is pretty difficult to adjust a suitable sweating rate for different tested garments in order to avoid water dripping. Thus, it limits the application of mass loss method. The measurements are mainly determined by the heat loss method. Sweating thermal manikins such as Walter and Kyoto Electronics Manikin belong to the third category (Fan and Chen, 2002; Fukazawa et al., 2004). The measurements of clothing evaporative resistance using this type of sweating thermal manikins are based on the mass loss method. Therefore, the clothing evaporative resistance determined on different types of sweating thermal manikins may differ a lot. In order to make those results comparable, a correction on the real evaporative heat loss (i.e. the observed value from the sweating thermal manikin) has to be made. One possible approach to correcting the real evaporative heat loss by adding the part of heat energy taken from the environment H e,env. An alternative method is using the real evaporative cooling efficiency to correct the real evaporative heat loss. The main objective of thermal manikin measurements on the determination of clothing evaporative resistance is to provide a physical value related to clothing moisture transfer property. It would be meaningless to determine this parameter at non-isothermal low ambient conditions because the complicated heat and moisture transfer pathways in such a cool/cold condition could definitely introduce further errors on the evaporative resistance. On the other hand, it is the main task for human-clothing-environment models (e.g. Xu and Werner, 1997) to consider those effects such as absorption, desorption, diffusion, and condensation on clothing evaporative resistance. Therefore, we suggest using only the isothermal condition to measure clothing evaporative resistance. This can avoid the combined effects of dry heat loss, condensation, and heat pipe on the clothing evaporative resistance (Havenith et al., 2008b). The mass loss method is always the correct option for clothing evaporative resistance testing conducted in the isothermal condition. The isothermal heat loss method should not be used except if a correction was made on the real evaporative heat loss. LIMITATIONS AND SUGGESTIONS This study had some limitations. The test conditions selected in this study (T manikin 5 T a 5 T r C) was not a strictly isothermal condition from a physical point of view. The isothermal condition should be defined as T sk 5 T a 5 T r (i.e. T manikin.t sk ). In this study, the observed pre-wetted skin temperature was lower than the manikin surface temperature due to water evaporation. That is why evaporative heat loss differences between those two calculation options have been observed. Currently, almost all sweating thermal manikins cannot control the wet skin surface temperature because there is no feedback between the wet textile fabric skin and manikin s controlling system. Perhaps, sweating thermal manikins Walter (Fan and Chen, 2002) and Coppelius (Meinander, 1992) are the few reported manikins that can regulate the skin surface temperature. However, it is questionable whether those manikins could regulate a relatively even distributed fabric skin surface temperature. Furthermore, selection of temperature sensors for measuring the wet textile skin temperature is a great challenge (Pušnik and Miklavec, 2009). The measured temperature value is highly dependent on the sensor size, attachment method, and number of sensors (Cheung and Sweeney, 2001). More suitable temperature sensors may emerge in the future. Finally, it is an urgent task to develop a skin manikin feedback system in order to control the wet textile skin surface temperature.
119 782 F. Wang et al. CONCLUSIONS In summary, the evaporative resistance based on the heat loss method produced greater values than those determined by the mass loss method. This is because part of the evaporative heat energy was taken from the environment. Thus, the heat loss method overestimated the heat stress. In order to avoid the combined effects of dry heat transfer, condensation, and the heat pipe on clothing evaporative resistance, thermal manikin measurements on the determination of clothing evaporative resistance should be performed in the isothermal condition. Furthermore, the mass loss method was suggested to be used to calculate clothing evaporative resistance. Otherwise, a correction on the real evaporative heat loss must be made for the heat loss method before application. FUNDING The Taiga AB in Varberg, Sweden. Acknowledgements We are grateful to the two anonymous referees for valuable comments. We would also like to thank the editor-in-chief, Dr Trevor Ogden, for the language improvements. REFERENCES Anttonen H, Niskanen J, Meinander H et al. (2004) Thermal manikin measurements exact or not? Int J Occup Saf Ergon; 10: ASTM F2370. (2010) Standard test method for measuring the evaporative resistance of clothing using a sweating manikin. Pennsylvania, PA: American Society for Testing and Materials. Bernard TE, Matheen F. (1999) Evaporative resistance and sustainable work under heat stress conditions for two cloth anticontamination ensembles. Int J Indus Ergo; 23: Besnard Y, Launay JC, Lebreton AG et al. (2004) Predictol: a computer program to determine the thermophysiological duration limited exposures in various climatic conditions. Comput Methods Programs Biomed; 76: Brebner DF, Kerslake DM, Waddell JL. (1956) The diffusion of water vapour through human skin. J Physiol; 132: Cain B. (2006) A preliminary study of heat strain using modelling and simulation. Technical Report No. DRDC TR Toronto, Canada: Defence Research and Development Canada. Caravello V. (2004) Total evaporative resistance of selected clothing ensembles. Dissertation. Tampa, FL: University of South Florida. Caravello V, McCullough EA, Ashlet CD et al. (2008) Apparent evaporative resistance at critical conditions for clothing ensembles. Eur J Appl Physiol; 104: Cheung SS, Sweeney DH. (2001) The influence of attachment method and clothing on skin temperature sensor accuracy. Med Sci Sports Exerc; 33: s161. Fan J, Chen YS. (2002) Measurement of clothing thermal insulation and moisture vapour resistance using a novel perspiring fabric thermal manikin. Meas Sci Technol; 13: Fukazawa T, Lee G, Matsuoka T et al. (2004) Heat and water vapour transfer of protective clothing systems in a cold environment, measured with a newly developed sweating thermal manikin. Eur J Appl Physiol; 92: Gallagher M. (2009) Development of a perceptual hyperthermia index to evaluate heat strain during treadmill exercise. Dissertation. Pittsburgh, PA: University of Pittsburgh. Gao C, Holmér I. (2006) Initial, transient and steady state evaporative resistance of impermeable protective clothing. In Fan J, editor. Proceedings of the 6th International Thermal Manikin and Modeling Meeting (6I3M). Hong Kong, China: Hong Kong Polytechnic University, pp Gao C, Holmér I, Fan J et al. (2006) The comparison of thermal properties of protective clothing using dry and sweating manikins. In Koradecka D, editor. Proceedings of the Third European Conference on protective Clothing (ECPC) and NOKOBETEF 8. Warsaw, Poland: Central Institute for Labour Protection, pp Gibson P, Auerbach M, Giblo J et al. (1994) Interlaboratory evaluation of a new sweating guarded hot plate test method (ISO 11092). J Build Phys; 18: Gonzalez RR, McLellan TM, Withey WR et al. (1997) Heat strain models applicable for protective clothing systems: comparison of core temperature response. J Appl Physiol; 83: Havenith G, Holmér I, den Hartog EA et al. (1999) Clothing evaporative heat resistance-proposal for improved representation in standards and models. Ann Occup Hyg; 43: Havenith G, Richards MG, Wang X et al. (2008a) Apparent latent heat of vaporization from clothing: attenuation and heat pipe effects. J Appl Physiol; 104: Havenith G, Richards M, Wang X et al. (2008b) Use of clothing vapor resistance values derived from manikin mass losses or isothermal heat losses may cause severe under and over estimation of heat stress. In da Silva MCG, editor. Proceedings of the 7th International Thermal Manikin and Modeling Meeting (7I3M). Coimbra, Portugal: University of Coimbra, pp Holmér I. (2004) Thermal manikin history and applications. Eur J Appl Physiol; 92: Holmér I. (2006) Protective clothing in hot environments. Indus Health; 44: Holmér I, Nilsson H. (1994) Heated manikins as a tool for evaluating clothing. Ann Occup Hyg; 39: Huang J. (2006) Sweating guarded hot plate test method. Poly Test; 25: Huang J. (2007) Assessment of clothing effects in thermal comfort standards: a review. J Test Eval; 35: Kolka MA, Stephenson LA, Gonzalez RR. (1994) Thermoregulation in women during uncompensable heat stress. J Therm Biol; 19: Kucera CL. (1954) Some relationships of evaporation rate to vapor pressure deficit and low wind velocity. Ecology; 35: Kuklane K, Holmér I, Anttonen H et al. (2005) Inter-laboratory tests on thermal foot models. Environmental Ergonomicsthe Ergonomics of Human Comfort, Health and Performance in the Thermal Environment. Vol. 3, Amsterdam, the Netherlands: Elsevier Science; pp Kuklane K, Sandsund M, Reinertsen RE et al. (2004) Comparison of thermal manikins of different body shapes and size. Eur J Appl Physiol; 92:
120 Determination of clothing evaporative resistance on a thermal manikin 783 Malchaire J, Kampmann B, Havenith G et al. (2000) Criteria for estimating acceptable exposure times in hot working environments: a review. Int Arch Occup Environ Health; 73: McCullough EA. (2001) Interlaboratory study of sweating thermal manikins. In Richards MGM, editor. Proceedings of the 4th International Meeting on Thermal Manikin. St. Gallen, Switzerland: EMPA, pp Measurement Technology Northwest (MTNW) Inc. (2010) Newton-sweating thermal manikin. Available at mtnw-usa.com/thermalsystems/products/full-body/thermalmanikin-newton.php. Accessed 11 November Meinander H. (1992) Coppelius a sweating thermal manikin for the assessment of functional clothing. In Meinander H, editor. Proceedings of Nokobetef IV: Quality and Usage of Protective Clothing. Kittilä, Finland: Tampere University of Technology; pp ISBN: Pušnik I, Miklavec A. (2009) Dilemmas in measurement of human body temperature. Instrum Sci Technol; 37: Richards MGM, McCullough EA. (2005) Revised interlaboratory study of sweating thermal manikins including results from the sweating agile thermal manikin. J ASTM Intl;2:1 13. Wang F. (2008) A comparative introduction on sweating thermal manikins Newton and Walter. In da Silva MCG, editor. Proceedings of the 7th International Thermal Manikin and Modeling Meeting (7I3M). Coimbra, Portugal: University of Coimbra, pp Wang F. (2010) Comparisons of thermal and evaporative resistances of kapok coats and down coats. Fibres Text East Eur; 18: Wang F, Kuklane K, Gao C et al. (2009) A study on evaporative resistances of two skins designed for thermal manikin Tore under different environmental conditions. J Fiber Bioeng Inform; 1: Wang F, Kuklane K, Gao C et al. (2010a) Development and validity of a universal empirical equation to predict skin surface temperature on thermal manikins. J Therm Biol; 35: Wang F, Kuklane K, Gao C et al. (2010b) Development and validation of an empirical equation to predict sweating skin surface temperature for thermal manikins. In Li Y, Qiu YP, Luo XN, and Li JS, editors. Textile Bioengineering and Informatics Symposium Proceedings, Vols 1-3. Shanghai, China: Donghua University, pp Xu X, Werner J. (1997) A dynamic model of the human/ clothing/environment-system. Appl Human Sci; 16:
121
122 Paper IV
123
124 Localised Boundary Air Layer and Clothing Evaporative Resistances for Individual Body Segments Faming Wang 1, Simona Del Ferraro 2, Li-Yen Lin 3, Tiago Sotto Mayor 4, Vincenzo Molinaro 2, Miguel Ribeiro 4, Chuansi Gao 1, Kalev Kuklane 1 and Ingvar Holmér 1 1 Thermal Environment Laboratory, Division of Ergonomics and Aerosol Technology, Department of Design Sciences, Faculty of Engineering, Lund University, Lund , Sweden 2 Laboratory of Physiology and Ergonomics, Department of Occupational Medicine, INAIL, Via Fontanta Candida Monteporzio Catone, Italy 3 Department of Testing and Certification, Taiwan Textile Research Institute (TTRI), 6 Chengtian Road, Tucheng District, New Taipei City, Taiwan 4 CeNTI, Centre for Nanotechnology and Smart Materials, Rua Fernando Mesquita, Vila Nova de Famalicão, Portugal Correspondent author: Faming Wang. Postal address: P.O. Box 118, Lund University, SE , Lund, Sweden Short running title: Localised Clothing Evaporative Resistance Tel.: ; Fax: faming.wang@design.lth.se Word count: 5750 These authors contribute equally to this work and order of authorship is listed alphabetically.
125 Abstract Evaporative resistance is an important parameter to predict one s body heat strain. However, previous work has focused mainly on either total static or dynamic evaporative resistance. There is a lack of investigation of localised clothing evaporative resistance. The objective of this study was to study localised evaporative resistance using sweating thermal manikins. The individual and interaction effects of air and body movements on localised resultant evaporative resistance were examined in a strict protocol. The boundary air layer s localised evaporative resistance was investigated on nude sweating manikins at 3 different air velocity (0.18, 0.48 and 0.78 m/s) and 3 different walking speeds (0, 0.96, and 1.17 m/s). Similarly, localised clothing evaporative resistance was measured on sweating manikins at 3 different air velocities (0.13, 0.48, and 0.70 m/s) and 3 walking speeds (0, 0.96 and 1.17 m/s). Results showed that the wind speed has distinct effects on local body segment. In contrast, walking speed brought much more effect on body limbs such as thigh and forearm than on body torso such as chest and waist. In addition, the combined effect of body and air movement on localised evaporative resistance demonstrated that the walking effect has more influence on the extremities than on the torso. Therefore, localised evaporative resistance values should be provided when reporting test results in order to clearly describe clothing local moisture transfer characteristics. Keywords: localised evaporative resistance; sweating thermal manikin; clothing ensemble; boundary air layer; reduction factor; local thermal comfort Statement of Relevance: Mainly due to walking and air velocities, which were investigated in this study, localised evaporative resistances at different local body segments may differ a lot. In this paper, clothing localised evaporative resistance was investigated and reduction equations for localised dynamic evaporative resistance were developed. The findings are very useful for clothing interface modelling for both human local thermal comfort studies and human thermoregulatory model developments.
126 Introduction Clothing evaporative resistance (or moisture vapour resistance, Fan and Chen 2002) is one of the most important physical parameters for both clothing thermal comfort and prediction of body heat strain when working in hot environments (Havenith et al. 1990b, Chen et al. 2003). With the increasing air temperature, the human body becomes more and more dependent on evaporative heat loss to keep heat balance. However, the evaporative heat loss can be greatly attenuated by wearing clothing (Havenith et al. 1999). Clothing evaporative resistance might be determined from measurement of its fabric material on a sweating guarded hot plate, clothing test on a sweating thermal manikin, or wear trial by human subjects (Gibson et al. 1994, ISO , McCullough 2001, Wang et al. 2009, Holmér and Elnäs 1981, Havenith et al. 1990b, Bernard and Matheen 1999). Although measurement of fabric material s evaporative resistance is essential, such a value is not enough to describe clothing property because it does not consider clothing design factors such as air gap and clothing pattern (Wang et al. 2011b). Therefore, determination of clothing evaporative resistance is more often performed on human subjects and sweating thermal manikins. Determination of clothing evaporative resistance on human subjects has been well documented in many previous studies. Holmér and Elnäs (1981) measured clothing effective evaporative resistance on human subjects using partitional calorimetry method. Nielsen et al. (1987) also performed human subject trials using the calorimetric method and found that the evaporative resistance was reduced by 39% when cycling compared to standing on a heavy garment. Lotens and Havenith (1988) tested impermeable rainwear using tracer gas method on human subjects. It was concluded that the evaporative resistance decreased by 77, 52, and 22%, respectively, when subjects were walking (1.2 m/s) under 0, 2 and 6 m/s wind speeds compared with standing at the respective wind speeds. Later Havenith et al. (1990b) conducted human subject measurements and determined clothing evaporative resistance using trace gas diffusion method. The effect of posture on clothing evaporative resistance was also examined in their study. They observed that the walking and wind decreased the evaporative resistance by 72-89% when compared to standing in relatively low wind. However, the tracer gas method does not consider the moisture transport mechanisms between clothing layers. Therefore, this is different from the real case. Recently, Caravello et al. (2005) studied the apparent total evaporative resistance of five work garments on 29 human subjects using a progressive protocol method. The measurement accuracy was highly enhanced and the standard deviations for resultant evaporative resistances ranged from to kpam 2 /W. However, human subject tests are time and money costly, and ethical issues are always involved. In addition, human trials are not reproducible due to individual differences.
127 Sweating thermal manikin is the most appropriate apparatus for determination of clothing evaporative resistance (Holmér et al. 1996, Holmér 1999, Fan and Chen 2002, Holmér 2006, Wang 2010a). However, a previous round robin study (McCullough 2001, Richards and McCullough 2005) has revealed that results are not highly repeatable and reproducible due to various reasons such as different sweating simulation methods, different test protocols, and technical dilemmas (Huang 2007, Wang et al. 2010b, Wang et al. 2011b). In order to get repeatable evaporative resistance values from a thermal manikin, Wang et al. (2011b) investigated the effect of temperature difference between manikin temperature and wet fabric skin temperature on evaporative resistance. It was found that the temperature difference could lead to an error of up to 35.9% on the boundary air layer s evaporative resistance. Moreover, this temperature difference could introduce an error of up to 23.7% on clothing evaporative resistance. Finally they suggested that the wet fabric skin temperature must be measured by attaching additional temperature sensors on the skin in order to reduce the potential errors made on clothing evaporative resistance. Later Wang et al. (2011a) examined the effect of different calculation options on clothing evaporative resistance at a so called isothermal condition (Tmanikin=Ta=Tr). They concluded that the mass loss method produces a lower evaporative resistance than that by the heat loss method. The mass loss method was suggested to be used to calculate clothing evaporative resistance. Furthermore, those two calculation options could generate the same evaporative resistance value if measurements are performed in a real isothermal condition (Tsk=Ta=Tr). By strictly controlling the testing protocol and choosing reasonable calculation method, the measurement repeatability on clothing evaporative resistance could be greatly enhanced. Almost all researches have currently focused on clothing total evaporative resistance or total resultant/dynamic evaporative resistance (Havenith et al. 1990b, Caravello et al. 2005, Wang et al. 2009, Wu et al. 2011). However, little is known on how the local evaporative resistance changes with posture, walking and/or wind. More importantly, an overall/total evaporative resistance value cannot always provide detailed characteristic information for clothing local area. On the other hand, the ability to describe clothing local effects on human skin temperature has lagged human thermoregulatory modelling (Nelson et al. 2005). There is a great need to study localised clothing evaporative resistance. Also, it is useful to investigate the effects of body and air movement on localised clothing evaporative resistance. Such investigations are of great importance for studies on both human local thermal comfort and thermoregulatory modelling. The purpose of the present study was to study localised evaporative resistance of both boundary air layer and clothing ensembles. The individual and interaction effects of walking and wind on localised evaporative resistance were
128 extensively investigated. Furthermore, empirical equations for prediction of localised dynamic evaporative resistance were developed. Methods Thermal manikin The Newton thermal manikins (MTNW, Seattle, WA) were used in this study (Wang and Lee, 2010c). This type manikin has a carbon epoxy shell with embedded heating and measuring wire sensors. The controlling system was developed using advanced CAD digital modelling to ensure manufacture repeatability. In addition, the manikin was fully jointed, providing motions at elbows, hips, knees and ankles to allow any possible body postures. The manikin uses an external constant pressure pump to control its local fluid supply to each segment. There are more than 134 sweating holes distributed uniformly over the whole body. The local body heat loss, temperature, sweat rate were acquired through either ThermDAC software or newly developed ManikinPC 2 (manikin physiology control and predictive comfort) software (ThermoAnalytics Inc., Calumet, MI). Test protocols The fabric skin was fully wetted with distilled water prior to dressing the manikin. An appropriate flow rate ( ml/hr/m 2 ) for each segment was adjusted to ensure its local fabric skin was fully wet throughout the experimental period. Fourteen thermocouples (copper-constantan, data logger: Testo 177-T4, Testo AG, Germany) were attached on the right part of the wet skin surface using thread rings to record local body segment s skin temperature (Fig.1). The air temperature (Betatherm/MTNW temperature sensors), relative humidity (Vaisala humidity sensor) and air velocity (TSI air flow transducer) were monitored throughout the whole experiment. The segmental heat losses were directly obtained from the manikin program Fig.1 near here Previous studies (Wilbik-Halgas et al. 2006, Bivainyte and Mikucioniene 2011) have demonstrated that there is no correlation between clothing air permeability and its water vapour permeability. On the other hand, Kaplan and Okur (2010) and Irandoukht and Irandoukht (2011) found that the fabric weight was significantly correlated with its water vapour resistance. Thus in this study, the fabric mass per unit area was used as one of the predictors for localised clothing resultant evaporative resistance. The fabric weight was determined as follows: cm fabric specimens were conditioned in a standardized condition room (20.0±1.0 ºC, RH=65±2%) for at least 24 h before measurements (ISO ). The specimens were weighed on a balance
129 (Mettler Type AE260S, Mettler-Toledo AG, Switzerland; accuracy: g) according to ISO3801 (1977). Test results were reported in g/m 2. Calculations The localised clothing evaporative resistance is determined by Eq. (1) R ei, p p sk, i a Eq.(1) He i where, R e,i is the localised evaporative resistance at the segment i, kpam 2 /W; p sk,i is the localised water vapour pressure on the wet fabric skin at the segment i, kpa; p a is the water vapour pressure in the air, kpa; He i is the localised evaporative heat loss at the segment i, W/m 2. The correction/reduction factor Corr for the localised resultant evaporative resistance can be expressed by Eq.(2) R eri,, Corr Eq.(2) Reiref,, where, R e,r,i is the localised resultant/dynamic evaporative resistance at the segment i determined in a specific condition, kpam 2 /W; R e,i,ref is the localised static evaporative resistance of the segment i determined at reference condition, kpam 2 /W. In this study, the reference air velocities for the nude manikin measurements and for the clothing measurements were 0.18 and 0.13 m/s, respectively (Havenith and Nilsson 2004). Data obtained from each test scenario were gathered in a database and analysed with multiple nonlinear regression analysis using the software XLSTAT version 2011 (Addinsoft Inc., Brooklyn, NY). The prediction parameters used for nude measurement data were air velocity and walking speed, whereas the prediction parameters for clothing experimental data were air velocity, walking speed, and fabric weight. The correction equations for localised resultant evaporative resistance of each segment were developed accordingly. Test conditions and clothing ensembles The experiments were performed at three different research institutes: CeNTI in Portugal, TTRI in Taiwan and INAIL in Italy. All measurements were conducted at an air temperature of 34.0 ºC and the relative humidity 38.0%. The manikin surface temperature was controlled at 34.0 ºC. The nude skin
130 measurements were performed at two research institutes: CeNTI and TTRI. Two air speeds were selected at CeNTI: 0.18 and 0.48 m/s, which were were created by adjusting ventilation rate inside the climatic chamber; the only air speed of 0.78 m/s was used at TTRI, which was generated by a large fan placed in front of thermal manikin. A honeycomb was mounted in front of the fan to reduce turbulence (Nilsson 1997). The CeNTI and INAIL participated clothing experiments. The two air speeds of 0.13 and 0.48 m/s were observed at CeNTI, whereas the used air speed at INAIL was 0.70 m/s. The air ventilation systems inside the chamber at CeNTI and INAIL are very similar, i.e., air enters from front mesh wall facing to the anterior part of the thermal manikin and exits through back mesh wall. Three walking speeds were used: 0, 45 and 55 dspm (double steps per minute). The corresponding walking speeds were 0, 0.96 and 1.17 m/s, respectively. Three different patterns of light clothing ensembles were used: permeable overall, tee-shirt and knee pants, and long sleeve military jacket and military long trousers. The details of these three clothing ensembles are listed in Table Table 1 near here Results Wind effect on localised evaporative resistance (boundary air layer) The effect of air velocity on boundary air layer s dynamic evaporative resistance at each local segment is displayed in Fig.2 (walking speed w=0 m/s). The linear regression curves show very good prediction (R>0.95). As expected, the localised evaporative resistance decreases with increasing air velocity. However, the reduction rate differs a lot among different segments. The reduction rates at the face, upper arm, hand and foot under 0.78 m/s wind were the lowest, ranging from 48.6 to 55.9%, whereas the reduction rates at the head, shoulders, back and thigh were the highest, ranging from 72.5 to 86.9% Fig.2 near here Walking effect on localised evaporative resistance at reference air speed (boundary air layer) The effect of walking speed on localised dynamic evaporative resistance at the reference air velocity was examined (Fig.3). The correlation factors demonstrate that predictions are good (R>0.93). The walking speed decreases local evaporative resistance at the extremities much more than on other segments. The reduction rate of the localised evaporative resistance at the thigh was the greatest of all 14 segments, when the manikin was walking at 1.17 m/s compared with standing (reduction of 64.8%, i.e., kpam 2 /W). The reduction on localised evaporative resistances at segments such as face, head
131 and chest were less than 10% of that on the thigh for the same walking condition. The reduction on localised evaporative resistance at the forearm was greater than that on the upper arm. The arm swing created local turbulent air flow which led to stronger decrease of the evaporative resistances at the manikin torso (shoulders and back) than at the face Fig.3 near here Interaction effect of air and body movement on localised evaporative resistance (boundary air layer) The relationship among air speed, walking speed and the localised boundary air layer s evaporative resistance has been also examined by multiple nonlinear regressions. In order to ensure that the correction factor equals 1 for measurements made at standing posture with less than 0.18 m/s wind, a subtraction of this reference wind speed was made. The correction factors for the boundary air layer s evaporative resistance R ea at each local manikin segment are plotted in Fig.4. The prediction quality is judged by the correlation factor R and the SEE (standard errors of the estimate) value Fig.4 near here The correction equation for localised boundary air layer s evaporative resistance reads R Corr R ear ea 2 2 exp a ( v 0.18) b ( v 0.18) c w d w R a a ea where, a, b, c and d are coefficients; v a is the wind velocity inside the climatic chamber, m/s; w is the walking speed, m/s (the maximum walking speed is 55 dspm); the validity intervals for the reduction equations are m/s wind speed and m/s walking speed. The coefficients a, b, c and d, correlation factor R 2 and SEE values for each local segment are displayed in Table Table 2 near here Correction equations for localised clothing evaporative resistance
132 For the data obtained from clothing measurements, there was no covering on the manikin s hand, face, head and foot, thus these four segments were excluded from the analysis. The relation between air velocity, walking speed, and fabric weight and correction factors for localised clothing evaporative resistance at the remaining 10 local segments, was determined by multiple nonlinear regressions. The correction equation is written as R Corr R etr et 2 2 e exp a ( v 0.13) b ( v 0.13) c w d w W R a a f et where, a, b, c, d and e are coefficients; v a is the wind speed relative to the manikin inside the climatic chamber, m/s (range: m/s), in this study, the observed minimum air velocity inside the climatic chamber at CeNTI was 0.13 m/s, thus this values was treated as the reference air speed; w is the walking speed, m/s, the maximum walking speed is 55 dspm; W f is the fabric weight (range: g/m 2 ). The coefficients a, b, c, d and e, correlation factor R 2 and SEE values for each local segment are displayed in Table Table 3 near here Discussion To the best of our knowledge, this paper is the first study to investigate both individual and interaction effects of air and body movement on localised evaporative resistance using sweating thermal manikins. The international standard ISO 9920 (2009) has published an empirical equation to estimate combined effects of air and body movement on total clothing evaporative resistance. However, this equation was deduced through an indirect approachi m approach, i.e., by deduction from clothing dynamic permeability index, dynamic total thermal insulation and the Lewis relation (Havenith et al. 2002). The reasons are probably due to little data are available on clothing evaporative resistance and such measurements are rather complex and expensive (Havenith et al. 1999). It should be also noted that this standard aims at providing a method to estimate clothing insulation and evaporative resistance rather than measure the values. In this study, we used a direct approach to investigate localised evaporative resistance. The results are more reliable as the accuracy of reduction equations is further improved.
133 Belghazi et al. (2005) studied the effect of air velocity on whole body and regional evaporative heat transfer coefficients in neonates using a thermal mannequin. Since their baby manikin has a supine posture, was placed in an incubator and exposed to various turbulent air speeds, it is very difficult to compare our data with their results. On the other hand, the evaporative heat transfer coefficient h e is inversely related to the evaporative resistance and the Lewis relation suggests h e /h c =16.5 Kelvin per kilopascal (h c is the convective heat transfer coefficient, Parsons 1988). In our study, we found that the smaller the diameter of a local segment (such as the hand, forearm, calf and foot), the smaller the localised evaporative resistance, i.e., the higher the localised evaporative heat transfer coefficient and the greater the evaporative capacity. The results are consistent with Belghazi et al. s findings (2005). The intersegment differences between upper limbs and the torso ranged from %. Belghazi et al. (2005) observed the differences were 30% on their baby manikin. One possible reason for those differences could be that their baby manikin has a relatively small surface area compared with our adult manikins. De Dear et al. (1997) investigated the convective and radiative heat transfer coefficients for individual human body segments using a 16-segment articulated thermal manikin. They observed that the hands, feet and peripheral limbs had higher convective heat transfer coefficients than the central torso region. It can be deduced from Lewis relation that the evaporative heat transfer coefficients at those extremities also had greater values than those at the central torso. Therefore, the evaporative resistances at those segments such as hands, feet, and limbs were smaller than those at the torso such as back, shoulders, waist, and chest. The results presented in this study show good agreement with their observations. Moreover, the air inside the climatic chamber comes from the front mesh wall and flows toward the anterior region of the thermal manikin. Theoretically, the localised convective heat transfer coefficients at the anterior body segments are much greater than those at the posterior body segments. The localised evaporative heat transfer coefficients are also greater at the front than those at the back. Therefore, the localised evaporative resistances at the front local segments are smaller than those at the back. Our results (boundary air layer s evaporative resistances) determined at the reference condition (v a =0.18 m/s, w=0 m/s) are in good agreement with this theoretical analysis. The localised evaporative resistances at the chest, stomach, and waist are , and kpam 2 /W, respectively. In contrast, localised evaporative resistances at the shoulders and the back are and kpam 2 /W respectively, which are % greater than those observed at the anterior local body segments. Furthermore, clothing thermal insulation is equal to the inverse of total dry heat transfer coefficient. It consists of two parts: convective heat transfer
134 coefficient and radiative heat transfer coefficient, whereas the evaporative resistance is inversely related to evaporative heat transfer coefficient. Thus it is anticipated that reduction in the evaporative resistance at the same wind and body movement condition will be greater than that in thermal insulation. The localised boundary air layer s evaporative resistance decreased by % at an air velocity of 0.78 m/s and a walking speed of 1.17 m/s compared with those measured at the reference condition (standing with an air velocity of 0.18 m/s). Those values compare well with the data from Havenith et al. s study (1990b). The previous reported reductions (Nielsen et al. 1985, Gaspar et al. 2006, Havenith et al. 1990a, Holmér et al. 1992, Holmér and Nilsson 1995) on clothing thermal insulation determined at similar conditions are much smaller than our observed reduction values on the evaporative resistance. The present study also demonstrated that body movement has greater influence on the extremities such as forearm, hand, thigh, calf and foot than on the torso. At high wind speeds, the body movement has very little effect on the localised evaporative resistance. At higher walking speeds, the wind effect has smaller effect than at lower walking speed. This trend becomes even more obvious at the body extremities such as hands, feet, thigh, and arms. These findings fit very well with the results concluded by Havenith et al. (1990b). Finally, the moisture transfer became more complex when clothing ensembles were dressed on the sweating manikin. The clothing ventilation resulting from posture, body movement, wind, air gap and apertures of clothing (open/close) can greatly influence the localised evaporative resistance. The observed reductions at the limbs such as upper arm, forearm, thigh and calf were greater than these generated by the empirical equation given in the ISO 9920 (2009) standard. On the other hand, reductions at some local body segments, such as chest and shoulders, were smaller than those produced by this equation. Consequently, the empirical equation (i.e., Eq.38) presented in the ISO9920 standard should not be used when estimating localised clothing evaporative resistance. The empirical equations presented in this study provide a good choice for estimating localised clothing evaporative resistance. Limitations and suggestions In this study, all measurements were performed at low air velocities (<1.0 m/s), representing typical indoor condition. The outdoor air velocity is often greater than 1.0 m/s at most of working places. Thus further experiments under higher air velocity are needed in order to expand the result database. In addition, we only tested three sets of one-layer light clothing ensembles. More experiments with multi-layer thermal protective clothing are required in order to extend the equation applicability. Second, the heat loss method was only used for calculation of localised evaporation resistance. In order to apply the mass loss method (ASTM 2010; Wang et al. 2011b) for calculation, one
135 possible solution could be that using instruments such as EPI evaporimeter (Pinnagoda et al. 1990) and perspiration meter (SKD-2000, Nishizawa Electric Meters Manufacturing Co., Japan) to determine local mass loss rate from the wet fabric skin. Third, the effect of wind direction on localised resultant evaporative resistance was not investigated. The wind direction can greatly influence local body heat loss, and thus localised evaporative resistance at different segment might vary. Finally, the manikins were fixed on a frame and this differs from the real human walking case. Therefore, the results obtained from the head, face and torso may slightly differ from those obtained in real cases. Conclusions Clothing local moisture transfer property should be quantified by localised evaporative resistance rather than by a total/overall evaporative resistance of the whole clothing ensemble. The localised dynamic evaporative resistance resulting from combined air and body movement varies a lot, which mainly depends on local body shape, position and local ventilation characteristics. Finally, local clothing evaporative resistance is of great importance for both human local body thermal comfort study and human-clothing-environment modelling.
136 References American Society for Testing and Materials, ASTM F2370, Standard test method for measuring the evaporative resistance of clothing using a sweating manikin. Belghazi, K. et al., Assessment of whole body and regional evaporative heat loss coefficients in very premature infants using a thermal mannequin: influence of air velocity. Medical Physics, 32:3, pp Bernard, T.E. and Matheen, F., Evaporative resistance and sustainable work under heat stress conditions for two cloth anticontamination ensembles-a function of body movement, posture, wind, clothing fit and ensemble thickness. International Journal of Industrial Ergonomics, 23:5, pp Bivainyte, A. and Mikucioniene, D., Investigation on the air and water vapour permeability of double-layered weft knitted fabrics. Fibres & Textiles in Eastern Europe, 19:3, pp Caravello, V. et al., Apparent evaporative resistance at critical conditions for five clothing ensembles. European Journal of Applied Physiology, 104:2, pp Chen, Y.S., Fan, J. and Zhang, W., Clothing thermal insulation during sweating. Textile Research Journal, 73:2, pp De Dear RJ et al., Convective and radiative heat transfer coefficients for individual human body segments. International Journal of Biometeorology, 40:3, pp Fan, J. and Chen, Y.S., Measurement of clothing thermal insulation and moisture vapour resistance using a novel perspiring fabric thermal manikin. Measurement Science and Technology, 13:7, pp Gaspar, A.R., Oliveira, A.V. and Quintela, D.A., Effects of walking and air velocity on convective heat transfer from a nude manikin. In: Winsdor Conference: Comfort and Energy Use in Buildings: Getting Them Right- International Conference, Windsor Great Park, UK, April Gibson, P., et al., Interlaboratory evaluation of a new sweating guarded hot plate test method (ISO 11092). Journal of Building and Physics, 18:2, pp Havenith, G., Heus, R. and Lotens, W.A., 1990a. Resultant clothing insulation: a function of body movement, posture, wind, clothing fit and ensemble thickness. Ergonomics, 33:1, pp Havenith, G., Heus, R. and Lotens, W.A., 1990b. Clothing ventilation, vapour resistance and permeability index: changes due to posture, movement and wind. Ergonomics, 33:8, pp Havenith, G. et al., Evaluation and selection of the clothing: influence on evaporation. In: Malchaire J (ed), Proceedings of the BIOMED HEAT Conference on Evaluation and Control of Warm Working Conditions,
137 BIOMED Heat Stress Research project, Barcelona, June 1998, pp Havenith, G., Holmér, I. and Parsons, K., Personal factors in thermal comfort assessment: clothing properties and metabolic heat production. Energy and Buildings, 34:6, pp Havenith, G. and Nilsson, H.O., Correction of clothing insulation for movement and wind effects, a meta-analysis. European Journal of Applied Physiology, 92:6, pp Holmér, I., The role of performance tests, manikins and test houses in defining clothing characteristics relevant to risk assessment. Annals of Occupational Hygiene, 43:5, pp Holmér, I., Protective clothing in hot environments. Industrial Health, 44:3, pp Holmér, I. and Elnäs, S., Physiological evaluation of the resistance to evaporative heat transfer by clothing. Ergonomics, 24:1, pp Holmér, I., et al., Effect of wind and body movements on clothing insulation-measurement with a moveable thermal manikin. In: Lotens WA and Havenith G (eds) Proceedings of the Fifth International Conference on Environmental Ergonomic (ICEE), 2-6 November 1992, Maastricht, the Netherlands, pp Holmér, I. and Nilsson, H., Heated manikin as a tool for evaluating clothing. Annals of Occupational Hygiene, 39:6, pp Holmér, I., Nilsson, H. and Meinander, H., Evaluation of clothing heat transfer by dry and sweating manikin measurements. In: Johnson JS and Mansdorf SZ (eds), Performance of Protective Clothing, fifth volume, ASTM STP 1237, American Society for Testing and Materials, pp Huang, J., Assessment of clothing effects in thermal comfort standards: a review. Journal of Testing and Evaluation, 35:5, pp International Organization for Standardization, ISO 3801, Textiles- Woven fabric-determination of mass per unit length and mass per unit area. International Organization for Standardization, ISO 5084, Textiles- Determination of thickness of textiles and textile products. International Organization for Standardization, ISO 139, Textiles- Standard atmospheres for conditioning and testing. International Organization for Standardization, ISO 9920, Ergonomics of the thermal environment-estimation of thermal insulation and water vapour resistance of a clothing ensemble. Irandoukht, S. and Irandoukht, A., Development of the predictive models for the fabric water vapor resistance. Journal of Engineered Fibers and Fabrics, 6:2, pp Kaplan, S. and Okur, A., A new dynamic sweating hotplate system for steady-state and dynamic thermal comfort measurements. Measurement Science and Technology, 21:8, doi: / /21/8/
138 Lotens, W.A. and Havenith, G., Ventilation of rain wear determined by a tracer gas method. In: Mekjavic IB, Banister EW and Morison JB (eds), Environmental Ergonomics, pp McCullough, E.A., Interlaboratory study of sweating thermal manikins. In: Richards MGM (ed) Proceedings of the Fourth International Meeting on Thermal Manikin, EMPA, Switzerland, September , pp Nelson, D.A., et al., Determining localised garment insulation values from manikin studies: computational method and results. European Journal of Applied Physiology, 95:5-6, pp Nielsen, R., Olesen, B.W. and Fanger, P.O., Effect of physical activity and air velocity on the thermal insulation of clothing. Ergonomics, 28:12, pp Nielsen, R., Olesen, B.W. and Holmér, I., Effect of exercise on the thermal resistances of a heavy work garment. In: Proceedings from the 1987 American Industrial Hygiene Conference, Montreal, pp Nilsson, H., Prediction of motion effects from static manikin measurements. In: Nilsson H and Holmér I (eds) Proceedings of a European Seminar on Thermal Manikin Testing, National institute for Working Life, Stockholm, 12 February 1997, pp Parsons, K.C., Protective clothing: heat exchange and physiological objectives. Ergonomics, 31:7, pp Pinnagoda, J., et al., Guidelines for transepidermal water loss (TEWL) measurement-a report from the standardization group of the European Society of Contact Dermatitis. Contact Dermatitis, 22:3, pp Richards, M.G.M. and McCullough, E.A., Revised Interlaboratory study of sweating thermal manikins including results from the sweating agile thermal manikin. Journal of ASTM International, 2:4, pp ThermoAnalytics Inc., Manikin PC2 Brochure. Available from: accessed on 17 January Wang, F., 2010a. Comparisons of thermal and evaporative resistances of kapok coats and traditional down coats. Fibres & Textiles in Eastern Europe, 18:1, pp Wang, F., et al., 2011a. Determination of clothing evaporative resistance on a sweating thermal manikin in an isothermal condition: heat loss method or mass loss method?. Annals of Occupational Hygiene, doi: /annhyg/mer034. Wang, F., et al., A study on evaporative resistances of two skins designed for thermal manikin Tore under different environmental conditions. Journal of Fiber Bioengineering and Informatics, 1:4, pp Wang, F., et al., 2011b. Effect of temperature difference between manikin and wet fabric skin surfaces on clothing evaporative resistance: how much error is there?. International Journal of Biometeorology, doi: /s z.
139 Wang, F., et al., 2010b. Development and validity of a universal empirical equation to predict skin surface temperature on thermal manikins. Journal of Thermal Biology, 35:4, pp Wang, F. and Lee, H., 2010c. Evaluation of an electrically heated vest (EHV) using a thermal manikin in cold environments. Annals of Occupational Hygiene, 54:1, pp Wilbik-Halgas, B., et al., Air and water vapour permeability in doublelayered knitted fabrics with different raw materials. Fibres & Textiles in Eastern Europe, 14:3, pp Wu, Y.S., Fan, J.T. and Yu, W., Effect of posture positions on the evaporative resistance and thermal insulation of clothing. Ergonomics, 54:3, pp
140 Tables Table 1 The characteristics of clothing ensembles. Clothing ensemble code PERM Garment component Permeable overall (hydrophobic layer laminated with inner PTFE membrane) Fabric thickness mm Weight g/m SR Tee-shirt (100% polyester) Riverside knee pants (65% polyester, 35% cotton) MIL Military jacket and trousers (50% cotton, 50% polyamide) Note: The fabric thickness was determined on a thickness tester according to ISO5084 (1996), the pressure was 10.2 g/cm 2 and the diameter of pressure foot was 50.8 mm.
141 Table 2 Coefficients, correlation factor and the SEE values of the reduction equations (localised boundary air layer s evaporative resistance). Segment a b c d R 2 SEE Face Head Chest Shoulders Stomach Back Upper arm Forearm Hand Waist Hip Thigh Calf Foot
142 Table 3 Coefficients, correlation factors and the SEE values of the reduction equations (localised clothing evaporative resistance). Segment a b c d e R 2 SEE Chest Shoulders Stomach Back Upper arm Forearm Waist Hip Thigh Calf
143 Figures Fig.1 Location of temperature sensors on saturated wet fabric skin: 1-face, 2- head, 3-chest, 4-shoulders, 5-stomach, 6-back, 7-right upper arm, 8-right forearm, 9-right hand, 10-waist, 11-right hip, 12-right thigh, 13-right calf, 14- right foot.
144 Fig.2
145 Fig.2 (continue)
146 Fig2 (continue)
147 Fig.2 (continue)
148 Fig.2 Effect of air speed on localised boundary air layer s evaporative resistance.
149 Fig.3
150 Fig.3 (continue)
151 Fig.3 (continue)
152 Fig.3 (continue)
153 Fig.3 Effect of walking speed on localised boundary air layer s evaporative resistance at reference air speed (0.18 m/s).

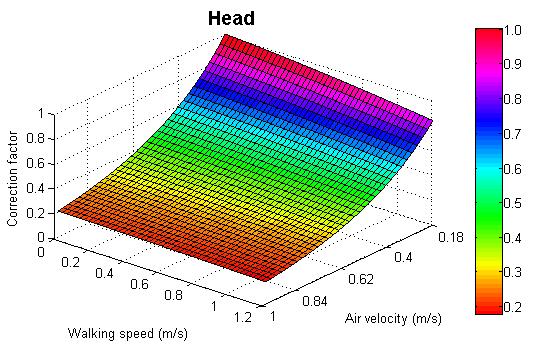
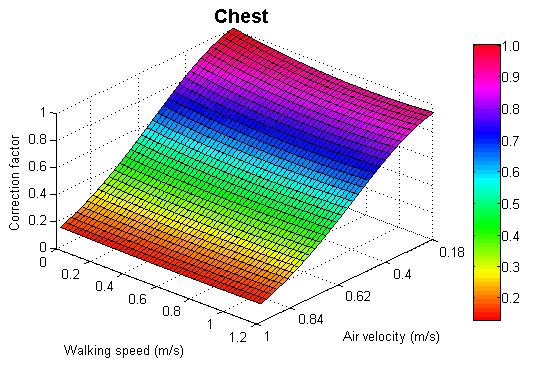
154 Fig.4
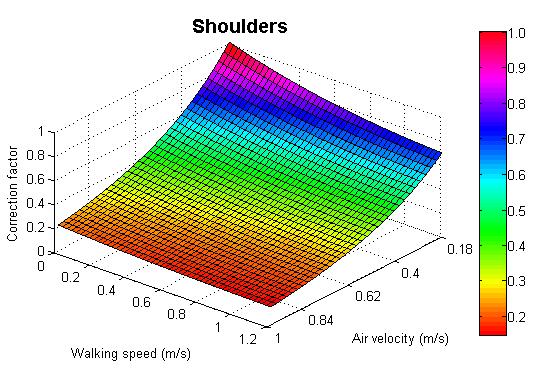
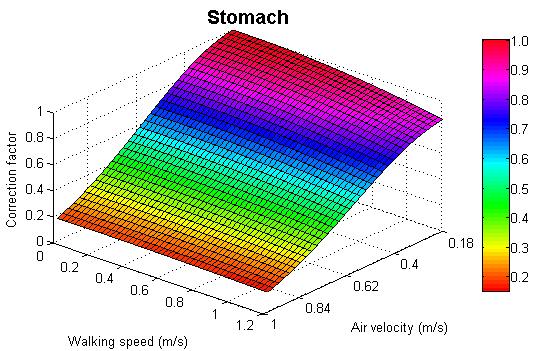
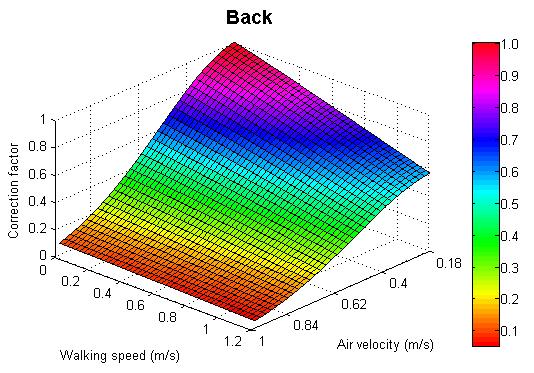
155 Fig.4 (continue)

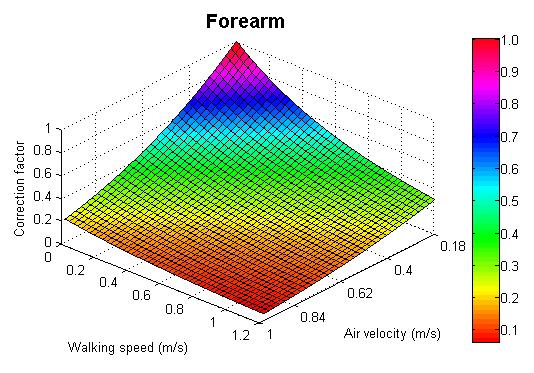
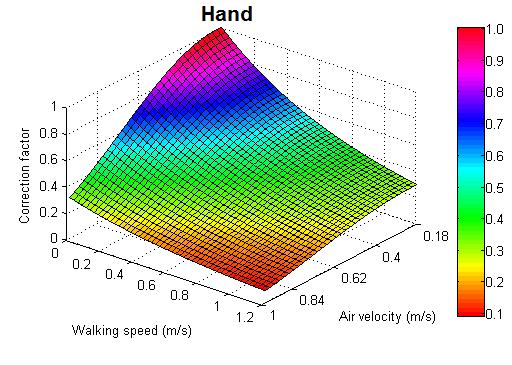
156 Fig.4 (continue)

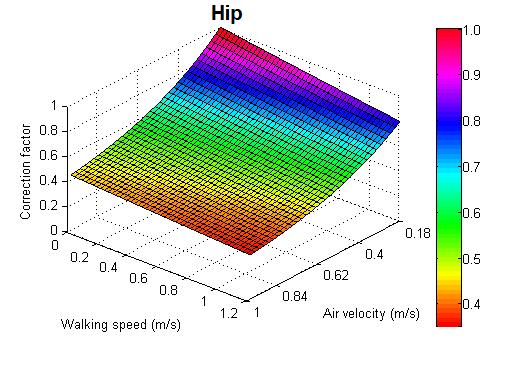
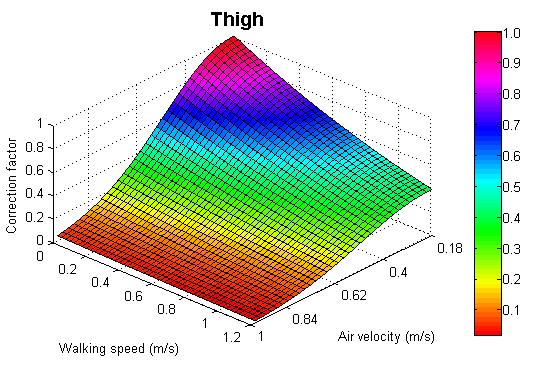
157 Fig.4 (continue)

 and walking speeds (0<w<1.")
158 Fig.4 Correction/reduction factor of R ea for each local manikin body segment at different air speeds (0<v a <1.0 m/s) and walking speeds (0<w<1.2 m/s).
159
160 Paper V
161
162 IOP PUBLISHING Physiol. Meas. 32 (2011) PHYSIOLOGICAL MEASUREMENT doi: / /32/2/007 Can the PHS model (ISO7933) predict reasonable thermophysiological responses while wearing protective clothing in hot environments? Faming Wang 1, Kalev Kuklane, Chuansi Gao and Ingvar Holmér Thermal Environment Laboratory, Division of Ergonomics and Aerosol Technology, Department of Design Sciences, Faculty of Engineering, Lund University, SE Lund, Sweden Received 4 September 2010, accepted for publication 23 November 2010 Published 22 December 2010 Online at stacks.iop.org/pm/32/239 Abstract In this paper, the prediction accuracy of the PHS (predicted heat strain) model on human physiological responses while wearing protective clothing ensembles was examined. Six human subjects (aged 29 ± 3 years) underwent three experimental trials in three different protective garments (clothing thermal insulation I cl ranges from 0.63 to 2.01 clo) in two hot environments (40 C, relative humidities: 30% and 45%). The observed and predicted mean skin temperature, core body temperature and sweat rate were presented and statistically compared. A significant difference was found in the metabolic rate between FIRE (firefighting clothing) and HV (high visibility clothing) or MIL (military clothing) (p < 0.001). Also, the development of heart rate demonstrated the significant effects of the exposure time and clothing ensembles. In addition, the predicted evaporation rate during HV, MIL and FIRE was much lower than the experimental values. Hence, the current PHS model is not applicable for protective clothing with intrinsic thermal insulations above 1.0 clo. The results showed that the PHS model generated unreliable predictions on body core temperature when human subjects wore thick protective clothing such as firefighting clothing (I cl > 1.0 clo). The predicted mean skin temperatures in three clothing ensembles HV, MIL and FIRE were also outside the expected limits. Thus, there is a need for further extension for the clothing insulation validation range of the PHS model. It is recommended that the PHS model should be amended and validated by 1 Author to whom any correspondence should be addressed /11/ $ Institute of Physics and Engineering in Medicine Printed in the UK 239
163 240 FWanget al individual algorithms, physical or physiological parameters, and further subject studies. Keywords: PHS model, heat stress, thermoregulatory modeling, protective clothing, hot environment (Some figures in this article are in colour only in the electronic version) 1. Introduction Over the past few decades, heat wave shocks and high rates of heat-related morbidity and mortality have become major urgent public health concerns (Semenza et al 1999, Weisskopf et al 2002, Kovats and Ebi 2006). Although progress has been made scientifically in understanding human thermophysiological responses to various hot environments, it is still a great challenge to predict heat strain accurately for most of the existing human thermoregulation models (Havenith 2001, Sanders 2003). On the other hand, there have been more than 60 heat stress indices developed over the last century to characterize the heat strain introduced by hot environments. However, no heat stress index has achieved widespread acceptance in the field (Brake and Bates 2002). The predicted heat strain (PHS) model was developed as a part of the EU BIOMED II (Biomedicine and Health) program and later adopted by ISO7933 (Malchaire et al 2001). It was aimed at predicting human physiological responses (i.e. predict core temperature and temperature increase over time) in hot environments for occupational groups (especially for standard subjects) (ISO7933 (ISO 2004)). The PHS model calculates heat exchange between the human body and environment, so it can be defined as a rational model (Brake and Bates 2002, Bethea and Parsons 2002). This model was derived from a previous heat stress index required sweat rate SW req (ISO7243 (ISO 1989), ISO7933 (ISO 1989)). One major criticism of this index was that it was only validated for clothing intrinsic thermal insulation I cl < 0.6 clo (1 clo = Cm 2 W 1 ). The PHS model has been validated by data obtained from 672 experiments in 8 European thermal physiology laboratories and 237 field experiments. The clothing intrinsic thermal insulations (mean ± SD) used in laboratory studies were 0.38 ± 0.34 clo and 0.77 ± 0.18 clo for field studies (Malchaire et al 2002). The validation range on clothing intrinsic thermal insulation was extended to I cl < 1.0 clo (Malchaire 2006). NIOSH (1986) stated that the thermal insulation values of the most of personal protective equipment (PPE) worn in industry were above 2 clo. Obviously, workers who are required to wear PPE in hot conditions have a much greater chance of suffering from heat stress than those wearing clothing with a thermal insulation value below 1.0 clo. For these reasons, a rational model such as the PHS model is required to supervise occupational workers to reduce physiological strains. Since the PHS model was only applicable for I cl < 1.0 clo, there is a need to further extend its validation range on clothing insulation in order to include most of the PPE. The main aim of this study was to check the prediction reliability of the PHS model on human physiological responses while wearing protective clothing. Three protective clothing ensembles with an intrinsic thermal insulation range of clo were selected for human trials under two hot environmental conditions. The observed and predicted skin temperature, core body temperature (i.e. rectal temperature), evaporation rate and sweat rate while wearing those protective clothing ensembles were presented and statistically compared. Finally, some suggestions on modification of the PHS model were discussed.

164 Can the PHS model predict reasonable thermophysiological responses 241 Figure 1. A schematic diagram of the PHS model. 2. Methods 2.1. PHS model Figure 1 shows a schematic diagram of the PHS model program (Malchaire 2009). The PHS model predicts the sweat rate, cumulated water loss, rectal temperature, and skin temperature curves as a function of the exposure time based on 13 input parameters: subject s weight, subject s height, acclimatization state of the subject, air temperature, globe temperature, relative humidity, air velocity, metabolic rate, posture, clothing intrinsic thermal insulation, permeability index, body surface fraction covered by reflective, and the emissivity of the reflective clothes. The clothing thermal insulation, emissivity of the reflective clothes, permeability index and the metabolic rate used in this model were usually taken from the reference tables specified in annexes C and D in ISO7933 (ISO 2004) Subjects Six male subjects voluntarily participated in the study. All participants were habitually active and in good health. The subjects were informed about the nature of the experiment and signed an informed consent before the participation. The study procedures followed the Helsinki Declaration. The subjects had the following characteristics (mean ± SD): age = 29 ± 3 years; body weight = 80 ± 8 kg; height = 178 ± 5 cm; body surface area = 1.98 ± 0.12 m 2 ; body mass index = 25.2 ± 2.2 kg m 2. The subjects were informed that they should neither smoke nor consume caffeine/alcohol 24 h before the experiment. They should also not carry out high intensive physical activities at least 1 h before the experiment. Each subject came to the lab and performed the exposures during the same period of the day with the intervals of at least 1 day between two experiments.
165 242 FWanget al Table 1. Details of the clothing ensembles. Total Intrinsic Clothing thermal thermal Evaporative Permeability ensemble insulation insulation resistance index Code components (clo) (clo) (kpa m 2 W 1 ) (nd) HV Short sleeve t-shirt, briefs, long trousers with 3M reflective materials, socks, sports shoes MIL Polyamide/cotton jacket, long trousers, short sleeve net t-shirt, briefs, socks, sports shoes FIRE RB90 firefighting clothes, underwear, t-shirt, briefs, socks, sports shoes HV: high visibility clothing; MIL: military clothing; FIRE: firefighting clothing; nd: nondimensional Experimental garments Three protective clothing ensembles mainly worn by road construction workers, military during warm season and firefighters were selected for this study. In order to enhance the input accuracy on clothing physical properties for the PHS model, thermal insulation and evaporative resistance were measured using a thermal manikin Tore (Holmér and Nilsson 1995). The tests followed two standards, i.e. ISO15831 (ISO 2004) and ASTM F2370 (ASTM 2010). The manikin surface temperature was controlled at 34 C. All dry tests were performed at an air temperature of 20 C and relative humidity of 45%. For wet tests to determine clothing evaporative resistance, a pre-wetted cotton fabric skin (fabric mass per unit area: 228 g m 2 ) was dressed on top of the dry heated thermal manikin. All wet tests were conducted under an isothermal condition, where the ambient temperature was set to 34 C and the relative humidity was 38%. The partial water vapour pressure inside the climatic chamber was 2 kpa accordingly. The air velocity in the chamber for both dry and wet tests was controlled at 0.33 ± 0.05 m s 1. The description and characteristics of all clothing ensembles are drawn in table Test procedure During preparation, all clothing, equipment (i.e. face mask, chest strap belt and pulse watch etc) and the subject (nude and with all clothing and equipment) were weighed on a weighing scale (KC240, Mettler-Toledo Inc., Zurich, Switzerland, accuracy: ±2 g). After the preparation, the subjects entered into a controlled climatic chamber and were asked to walk on a treadmill (Exercise TM X Track Elite, Sweden) at a speed of 4.5 km h 1. The subjects were weighed again after 30 min of walking. The heart rate, rectal (T re ) and skin (T sk ) temperatures were recorded continuously over the whole test period. The termination of walking and exposure was based on one of the following three criteria: (i) subjects felt the conditions were intolerable and were unable to continue, (ii) the rectal temperature T re reached 38.5 C or (iii) the time limit of 70 min reached, even if none of the above two criteria had been met.
166 Can the PHS model predict reasonable thermophysiological responses 243 After 70 min of walking, the subjects were weighed again immediately. Afterwards, they were allowed to take off equipment and clothing ensembles. Each piece of the clothing was quickly weighed separately as the subject removed it. Right after the subjects were undressed and the measuring equipment was removed, the subjects were weighed just wearing briefs and the rectal sensor. The sweat rate was calculated from the subject nude weight loss over time. The total evaporation rate was calculated by subtracting the post-exercise body weight from the pre-exercise body weight. The evaporation rate for the last 40 min exposure was also calculated Physiological measurements The rectal temperature sensor (YSI-401 Yellow Springs Instrument, Measurement Specialties Inc., USA, accuracy ±0.1 C) was inserted by the subjects at a depth of 10 cm above the anal sphincter. Skin temperature sensors (NTC-resistant temperature matched thermistors ACC-001, Rhopoint Components Ltd, UK, accuracy ±0.2 C, time constant 10 s) were taped on the left side of the body at four sites, i.e. chest, upper arm, thigh and calf. The mean skin temperature was calculated according to Ramanathan s formula (Ramanathan 1964): T sk = 0.3T sk chest +0.3T sk upperarm +0.2T sk thigh +0.2T sk calf. The rectal and skin temperatures were recorded via a LabVIEW R program (National Instruments Corp., USA) at an interval of 15 s from the point when the subject started walking on the treadmill. In order to get more reliable values on the metabolic rate, the input data used in the PHS model were obtained from oxygen consumption measurements rather than from the reference table (i.e. Annex C in ISO7933). The oxygen uptake was measured with a MetaMax I instrument (Cortex Biophysik GmbH, Germany) for 5 min after 10 min of walking. The heart rate was recorded by a Polar heart rate monitor and a chest strap (Sport Tester, Polar Electro Oy, Finland) during the whole test period Test conditions All human subject trials were performed at 40.0 C. Two levels of water vapour pressure in the climatic chamber were selected: 2.0 and 3.0 kpa, when combined with the ambient temperature, resulted in relative humidities of 27% and 41%, respectively. The observed relative humidities in the chamber were 30% and 45%, respectively. Thus, the real partial water vapour pressures in the chamber were 2.2 and 3.3 kpa, respectively. For clothing ensembles HV and FIRE, the trials were conducted at 2.2 kpa. The tests on clothing ensemble MIL were performed at 3.3 kpa. The air velocity was maintained at 0.33 ± 0.05 m s 1 for all exposures Statistical analysis Data are presented as mean ± standard deviation (SD). The root mean square deviation (RMSD) was used to check the prediction accuracy on the mean skin temperature and rectal temperature. The RMSD is a frequently used measure of differences between the values predicted by a model and the values actually observed from the phenomenon being modelled or estimated (O Brien et al 1998, Castellani et al 2007). The best prediction value is that which gives the minimal RMSD value. Generally, if RMSD < SD, the predicted values from PHS model coincide with the observed data from human trials (Bogerd et al 2010). Thus, it could be considered that the PHS model predicted acceptable data. On the other hand, the PHS model would generate unacceptable values if RMSD > SD. The differences in metabolic rates,
167 244 FWanget al Figure 2. The development of heart rate during HV, MIL and FIRE at 40.0 C. sweat rates and evaporation rates in three protective garments were analysed using multi-factor ANOVA (analysis of variance) followed by a multi-comparison post hoc test (LSD test). The level of significance was set at p < Results and discussion All subjects successfully completed the trials. One subject terminated the exposure after 63 min during FIRE due to the rectal temperature reached 38.5 C. The heart rate demonstrated the significant effects of the exposure time and clothing ensemble. The increase in mean heart rate during FIRE was significantly higher than in clothing HV or MIL (figure 2). On the other hand, heart rate rose significantly over the exposure time for all three protective clothing ensembles, ending at 110, 124 and 142 bpm (beats per minute) during HV, MIL, and FIRE, respectively. The observed sweat rate was considerably higher during FIRE than HV (figure 3). The subjects were significantly dehydrated during FIRE (p < 0.01), with a mean body weight loss of 0.96 kg, which accounted for about 1.2% of their total body weight. The predicted sweat rate obtained from the PHS model during HV was significantly higher than the experimental data (p < 0.05). The predicted values for clothing MIL and FIRE fall within the observed range. The mean evaporation rates for all three clothing ensembles were almost the same. However, the calculated evaporation rates from the last 40 min data showed significant differences between the mean evaporation rates based on 70 min data. This was probably due to the fact that the first 30 min were the sweating development period (Libert et al 1983). In addition, the predicted evaporation rate during HV, MIL and FIRE was much lower than the experimental values. The predicted and observed skin and rectal temperature curves while wearing three protective clothing ensembles HV, MIL and FIRE over time are plotted in figure 4. In the graphs, the prediction curves on body core temperature (T re-p ) for clothing ensembles HV and MIL followed the observed curves relatively closely. The initial rate of rise was slightly greater than in the observed curves due to the different initial starting points. However, the predictions on body core temperature during clothing FIRE showed a much greater rise than

168 Can the PHS model predict reasonable thermophysiological responses 245 Figure 3. The mean sweat rate Sw, the predicted sweat rate Swp, the mean evaporation rate E, the predicted evaporation rate Ep and the evaporation rate E40 calculated from the last 40 min exposure during HV, MIL and FIRE at 40.0 C. p < Table 2. The calculated RMSD values of the PHS model and the mean SD of experimental data. HV MIL FIRE RMSD (T sk ) SD RMSD (T re ) SD the experimental curve. The predicted ending point of the rectal temperature after 63 min exposure was 1.8 C greater than the observed value. For all predicted skin temperature curves, a much shallower rise in curves during the first 30 min was observed compared to the measured values. The predicted values stayed continuously lower than the observed temperature curves that, however, kept rising. For a given environmental condition and activity intensity, greater clothing thermal insulation resulted in more body heat strain. Hence, the heat strain parameters such as heart rate, skin temperature and rectal temperature were more pronounced. Also, the metabolic rate was usually higher due to heavier clothing equipment. The mean ± SD metabolic rates for HV and MIL were 165 ± 6 and 167 ± 7Wm 2, respectively. The weight of clothing ensemble FIRE was 6.7 kg, which was about three times heavier than clothing HV or MIL. It was also more stiff than the other two ensembles. The mean ± SD metabolic rate for FIRE was 190 ± 7Wm 2. Thus, there was a significant difference between FIRE and HV or MIL (p < 0.001). This finding is in accordance with the results reported by Dorman and Havenith (2008). The pre-exercise starting skin temperature and rectal temperature in the PHS model are 34.1 and 36.8 C, respectively. However, these values are different from our study because subjects had different physical activities before the test. The weather condition on the exposure day may also contribute to this difference (all trials were performed during the wintertime). In order to eliminate the effect of the initial temperature differences on the statistical result, data used for the statistical analysis excluded the first 10 min data, i.e. total 60 min data were
169 246 FWanget al Figure 4. Predicted and observed skin and rectal temperatures plotted as a function of the exposure time for three protective clothing ensembles: HV, MIL and FIRE. T re, mean observed rectal temperature; T sk, mean observed skin temperature; T re-p, predicted rectal temperature; T sk-p, predicted skin temperature. + One subjected stopped the exposure as the core temperature reached 38.5 C.
170 Can the PHS model predict reasonable thermophysiological responses 247 used for the analysis. Table 2 shows the RMSD values of the PHS model and the standard deviation of the experimental data. The predictions from any model are more than two time greater than the mean SD of the observed data which indicates that the model predictions fall outside of the 95% of an average population (Cadarette et al 1999). For the skin temperature, the RMSD was 2.0 to 3.2 times greater than the subject average mean standard deviation. Therefore, the predicted skin temperature values from the current PHS model were not reliable. One possible reason could be related to that the skin temperature prediction equation in the PHS program source code has the poorest and lowest correlation when a clothed subject exercises at a humidity level above 2 kpa (Mehnert et al 2000). For the rectal temperature, the RMSD values of clothing ensembles HV and MIL were within 1 SD of the observed data. Thus, the PHS model predicted acceptable rectal temperature values for these two clothing ensembles. However, for such a high insulating clothing ensemble as FIRE, the RMSD was 3.75 times greater than the subject average mean standard deviation. As expected, the prediction on rectal temperature for high insulation clothing ensemble FIRE would not function. Despite being an international standard (ISO7933 (ISO 2004)), the PHS model has been shown to be unable to cover all common heat stress scenarios at work places. Also, the implementation requires input data that may not always be available. The PHS model calculates the human body heat exchange/balance based on environmental parameters, human personal factors and clothing. However, some questionable modifications have been made based on the previous index SW req, modification of respiratory heat loss, distribution of body heat storage, and averaging the skin temperature and sweat rate exponentially. In addition, the validation data on both rectal temperature and sweat rate have revealed a large proportion of variation. The reasons have not yet explained. One possible reason could be that the estimation of human heat balance was based on a thermometry approach (Jay and Kenny 2010). Furthermore, the PHS model uses estimated clothing insulation and permeability index from the referenced database (ISO9920 (ISO 2007)) as the input data, which may not be that accurate (Gavhed et al 2000). The most reliable way is to measure the clothing thermal insulation on a dry heated thermal manikin (Holmér 2004) and evaporative resistance on a sweating guarded hotplate (ISO11092 (ISO 1993)) or a sweating thermal manikin (McCullough 2005, Havenith et al 2008, Wang et al 2009). The permeability index can be calculated from these two parameters accordingly. Although the PHS model considered the effects of walking and wind on clothing insulation and permeability index, the calculation of permeability index requires clothing evaporative resistance. One suggestion to simplify the calculation on the permeability index is to use an empirical equation to directly calculate the dynamic evaporative resistance (Havenith et al 1999, Huang 2007, ISO9920 (ISO 2007)). The mean skin temperature is one of the most important factors in those studies about the heat exchange between the human body and surrounding environments (Berger and Grivel 1989). However, the mean skin temperature prediction equation used in the PHS model was developed from a pure statistical way (Mehnert et al 2000). The effect of clothing (especially PPE) on the skin temperature was not considered. It should be noted that protective clothing might play two distinct roles: it slows the surrounding heat transferring to the human body if the skin temperature is lower than air temperature; on the other hand, it prevents the body heat transferring to the environment when the skin temperature is higher than the air temperature. Therefore, the empirical equation on mean skin temperature in the PHS model requires further modification. Finally, it is clear that the PHS model is based on the heat balance equation. The metabolic rate is one of the critical inputs that determine whether or not body heat storage will occur. In our study, although the input on metabolic rate was accurately measured using the
171 248 FWanget al cardiopulmonary instrument, the PHS model still generates errors on predicted physiological responses. On the other hand, people always use the estimated metabolic rate as an input for the PHS model in field studies. The estimation may have a quite low accuracy, which could generate even larger errors on the prediction. Moreover, some previous studies showed that estimation of the metabolic rate could introduce an error up to 60% (NIOSH 1986, ISO8996 (ISO 2004), Bethea and Parsons 2002). In order to improve the model prediction, the data from the reference table in ISO7933 must be used with care. More accurate methods are described in ISO9920 (ISO 2007). 4. Conclusions The PHS model generated the body core temperature predictions that lie outside reasonable limits when the subjects wore thick protective clothing such as firefighting clothing. This could be due to the fact that the PHS model was developed and validated based on occupational clothing with a thermal insulation value below 1.0 clo. The prediction on the mean skin temperature in three tested clothing ensembles also exceeded the set expectations (Pušnik and Miklavec 2009). That might be related to a poor correlation of the skin temperature empirical equation in the program source code with the test conditions specified in this study, e.g., higher partial vapour pressure in the air than 2 kpa. Thus, the PHS model has to be improved in order to achieve widespread acceptance for most common work situations involving heat stress. It may also need simplification in order to implement the method more widely by health and safety personnel at work sites who may not have required level of expertise. Moreover, errors on input parameters should be avoided in order to enhance the model prediction accuracy. It is therefore recommended that the PHS model should be amended and validated by individual algorithms, physical or physiological parameters, and further subject studies. Acknowledgments This study was supported by VINNOVA (Swedish Governmental Agency for Innovation Systems) R&D funding and the Taiga AB in Varberg, Sweden. The authors would also like to thank all subjects for their cooperation and perseverance in completing this study. References ASTM 2010 Standard test method for measuring the evaporative resistance of clothing using a sweating manikin ASTM F2370 American Society for Testing and Materials Berger X and Grivel F 1989 Mean skin temperature in warm humid climates Eur. J. Appl. Physiol Bethea D and Parsons K 2002 The development of a practical heat stress assessment methodology for use in UK industry Loughborough University Research Report 008 Bogerd N, Psikuta A, Daanen H A M and Rossi R M 2010 How to measure thermal effects of personal cooling system: human, thermal manikin and human simulator study Physiol. Meas Brake R and Bates G 2002 A valid method for comparing rational and empirical heat stress indices Ann. Occup. Hyg Cadarette B, Montain S, Kolka M, Stroschein L, Matthew W and Sawka M 1999 Cross validation of USARIEM heat strain prediction models Aviat. Space Environ. Med Castellani J W, Brien C, Tikuisis P, Sils I and Xu X 2007 Evaluation of two cold thermoregulatory models for prediction of core temperature during excise in cold water J. Appl. Physiol Dorman L E and Havenith G 2008 The effects of protective clothing on energy consumption during different activities Eur. J. Appl. Physiol Gavhed D, Kuklane K and Holmér I 2000 Thermal insulation of multi-layer clothing ensembles measured on a thermal manikin and estimated by six individuals using the summation method in ISO 9920 Proc. of NOKOBETET 6 and
172 Can the PHS model predict reasonable thermophysiological responses 249 1st European Conf. on Protective Clothing (Stockholm, Sweden, 7 10 May 2000) ed K Kuklane and I Holmér pp Havenith G 2001 Individualized model of human thermoregulation for the simulation of heat stress response J. Appl. Physiol Havenith G, Holmér I, den Hartog E A and Parsons K C 1999 Clothing evaporative heat resistance-proposal for improved representation in standards and models Ann. Occup. Hyg Havenith G, Richards M G, Wang X, Bröde P, Candas V, den Hartog E A, Holmér I, Kuklane K, Meinander H and Nocker W 2008 Apparent latent heat of evaporation from clothing: attenuation and heat pipe effects J. Appl. Physiol Holmér I 2004 Thermal manikin history and applications Eur. J. Appl. Physiol Holmér I and Nilsson H 1995 Heated manikins as a tool for evaluating clothing Ann. Occup. Hyg Huang J 2007 Prediction of air temperature for thermal comfort of people in outdoor environments Int. J. Biometeorol ISO 1993 Textiles physiological effects measurement of thermal and water-vapour resistance under steady-state conditions (sweating guarded-hotplate test) ISO11092 (Geneva: International Organization for Standardization) ISO 2004 Clothing physiological effects measurement of thermal insulation by means of a thermal manikin ISO15831 (Geneva: International Organization for Standardization) ISO 1989 Hot environments estimation of the heat stress on working man, based on the WBGT-index (wet bulb globe temperature) ISO7243 (Geneva: International Organization for Standardization) ISO 1989 Hot environments analytical determination and interpretation of thermal stress using calculation of required sweat rate ISO7933 (Geneva: International Organization for Standardization) ISO 2004 Ergonomics of the thermal environment analytical determination and interpretation of heat stress using calculation of the predicted heat strain ISO7933 (Geneva: International Organization for Standardization) ISO 2004 Ergonomics of the thermal environment determination of metabolic rate ISO8996 (Geneva: International Organization for Standardization) ISO 2007 Ergonomics of the thermal environment estimation of thermal insulation and water vapour resistance of a clothing ensemble ISO9920 (Geneva: International Organization for Standardization) Jay O and Kenny G P 2010 Heat exposure in the Canadian workplace Am. J. Ind. Med Kovats S R and Ebi K L 2006 Heatwaves and public heath in Europe Eur. J. Public Health Libert J P, Candas V and Vogt J J 1983 Modifications of sweating responses to thermal transients following heat acclimation Eur. J. Appl. Physiol Malchaire J B M 2006 Occupational heat stress assessment by the predicted heat strain model Ind. Health Malchaire J B M 2009 The predicted heat strain (PHS) model MS Excel VBA file, version Available at http;// Malchaire J et al 2001 Development and validation of the predicted heat strain model Ann. Occup. Hyg Malchaire J, Piette A, Kampmann B, Mehnert P, Gebhardt H, Havenith G, Holmér I, Parsons K, Alfano G and Griefahn B 2002 Assessment of the risk of heat disorders encountered during work in hot conditions Int. Arch. Occup. Environ. Health McCullough E A 2005 The use of thermal manikins to evaluate clothing and environmental factors Environmental Ergonomics vol 3 ed Y Tochihara and T Ohnaka (New York: Elsevier) pp Mehnert P, Malchaire J, Kampman B, Piette A, Griefahn B and Gebhardt H 2000 Prediction of the average skin temperature in warm and hot environments Eur. J. Appl. Physiol NIOSH 1986 Occupational exposure to hot environments DHHS Publication No (Washington, DC: National Institute for Occupational Safety and Health) O Brien C, Hoyt R W, Buller M J, Castellani J W and Young A J 1998 Telemetry pill measurement of core temperature in humans during active heating and cooling Med. Sci. Sports Exerc Pušnik I and Miklavec A 2009 Dilemmas in measurement of human body temperature Instrum. Sci. Technol Ramanathan N L 1964 A new weighting system for mean surface temperature of the human body J. Appl. Physiol Sanders P 2003 A comparison of the predictive accuracy of human thermoregulatory models Report DSTO-TR-1513 Chemical, Biological, Radiological and Nuclear Defense Centre of Australia Semenza J C, McCullough J E, Flanders W D, McGreehin M A and Lumpkin J R 1999 Excess hospital admissions during the July 1995 heat wave in Chicago Am. J. Prev. Med Wang F M, Gao C S, Kuklane K and Holmér I 2009 A study on evaporative resistances of two skins designed for thermal manikin Tore under different environmental conditions Textile Bioengineering and Informatics Symp. Proc. vols 1 2 pp Weisskopf M G, Anderson H A, Foldy S, Hanrahan L P, Blair K, Török T J and Rumm P D 2002 Heat wave morbidity and mortality, Milwaukee, Wis, 1999 versus 1995: an improved response Am. J. Public Health
173
174 Paper VI
175
176 Effects of Various Protective Garments and Thermal Environments on Heat Strain of Unacclimated Men: the PHS Model (ISO7933) revisited Faming Wang *, Chuansi Gao, Kalev Kuklane and Ingvar Holmér Thermal Environment Laboratory, Division of Ergonomics and Aerosol Technology, Department of Design Sciences, Faculty of Engineering, Lund University, Lund , Sweden Correspondent author: Faming Wang. Postal address: PO BOX 118, SE , Lund, Sweden Short running title: Effects of Clothing and Environments on Thermophysiological Responses of Men Tel.: ; Fax: Word count: 4900
177 Abstract Five protective garments (L, HV, MIL, CLM and FIRE) were assessed on eight unacclimated male subjects at two WBGT temperatures: 19.0 and 24.5 C. The thermophysiological responses and subjective sensations including thermal sensation, humidity sensation and Borg s RPE were reported. Moreover, the PHS model (ISO7933) was used to predict thermophysiological responses for each test scenario. It was found that there were significant differences between FIRE and other clothing on thermal sensation (p 0.05). Significant differences were detected on humidity sensation between FIRE and L, HV and MIL (p 0.001). The RPE in FIRE is significant different compared to L and HV (p 0.05). At 19.0 C WBGT, the post-exercise skin temperatures increased by 0.59 and 1.29 C in MIL and CLM. In contrast, skin temperatures in L, HV, MIL, CLM and FIRE at WBGT=24.5 o C increased by 1.7, 2.1, 2.1, 2.8 and 3.3 C, respectively, core temperatures increased by 0.32, 0.33, 0.39, 0.48 and 0.82 C, respectively. The PHS model presented good performance on the predicted mean skin temperature in MIL and CLM at both two moderate warm environments. However, the prediction on the skin temperature in light clothing at the high humidity environment was weak. For thick protective clothing, the prediction on rectal temperature showed highly conservative value. It is thus concluded that the present PHS model is inapplicable for high insulating clothing and measurements performed in humid environments. Further work is needed to revise the PHS model in order to enhance its applicability. Keywords: heat stress, heat strain, PHS model, thermophysiological response, protective clothing
178 Introduction People who are doing open air mining, power line constructing, military training, and firefighting jobs are frequently exposed to severe heat stress, which may deteriorate the productivity or even threaten the body survival (Allnutt and Allan, 1973; Epstein et al., 1980). Heat strain arises from different physical activities, clothing ensembles and thermal environments, which results in a rise in both body core and skin temperatures (Shibolet et al., 1976). The physical activity contributes to the total heat stress of the work by generating metabolic heat in the human body in proportion to the work intensity. The heat and moisture transfer characteristics of clothing worn affect the amount of heat stress by changing the dry and evaporative heat exchange rates between the body surface and the working environment(holmér, 2006). In addition, thermal environmental factors such as the air temperature, air velocity, water vapor pressure and radiation also contribute to the total heat stress (Epstein and Moran, 2006; Johnson, 1946; Millard and Withey, 1998). Many attempts have been made to assess or predict the corresponding physiological heat strain and to combine various heat stress parameters into a single index, such as the WBGT (wet-bulb globe temperature) index(iso- 7243, 1994) and the DI (discomfort index) index(jáuregui and Soto, 1967). The US Army Research Institute of Environmental Medicine (USARIEM) developed a Heat Strain Model (Cadarette et al., 1999). This empirical model predicts core temperature, maximum work times, sustainable work/rest cycles, water requirements and heat casualties. Second, many rational models have been developed for predicting body heat strain during the past 60 years, such as the heat strain index (HSI), the index of thermal stress (ITS) and the required sweat rate (ISO 7933) index. Third, more advanced human thermoregulatory models have also been developed. Such models are rather complicated and most of them were derived from a previous fundamental work made by Stolwijk and Hardy(Stolwijk and Hardy, 1977). For example, the LUT 25-node model, the Werner s model and the Tanabe s model (Parsons, 2003; Werner, 1989; Tanabe et al., 2002). Recently, a rational model Predicted Heat strain (PHS) model (Malchaire et al., 2001)was derived from an in-depth revision of the previous Required Sweat Rate model (ISO-7933, 1989; Malchaire et al., 2000)and new algorithms were created based on scientific literature concerning, convection, evaporative heat transfer, rectal and skin temperatures. This rational model was later adopted by ISO 7933 (2004) and was used as a tool to predict human thermo-physiological responses of a
179 standard person exposed in hot environments. More detailed information about the present PHS model can be found in papers authored by Malchaire et al. and also, the international standard ISO 7933 (ISO-7933, 2004; Malchaire, 2006; Malchaire et al., 2001). In a previous paper, we demonstrated that the PHS model presented unreasonable physiological data for subjects wore high insulating protective clothing in hot environments (Wang et al., 2011). In order to further check the applicability and prediction accuracy of the PHS model, we examined the human physiological responses of eight unacclimatized men in five protective clothing ensembles under two moderate warm environments. The PHS model was applied to check the prediction accuracy on subject s physiological responses such as the rectal temperature and mean skin temperature for each test scenario. Comparisons between observed and predicted data on the rectal temperature and mean skin temperature were also performed. The applicability of the present PHS model was finally addressed. Methods Subjects Eight unacclimated male volunteers with no history of heat illness participated in the study. The mean±sd age was 27±3 (range 24-34), height was 1.76±0.06 m (range ), weight was 77.0±10.2 kg (range 60-92), body surface area was 1.94±0.15 m 2 (range ) and the body mass index (BMI) was 24.6±2.2 kg/m 2 (range ). They were informed that they should not smoke and consume alcohol, coffee or tea two hours before the trial. They should not do high intensive physical activities at least one hour before the experiment either. Each subject performed testing during the same time of a day with an interval of at least 48h between trials in order to minimise the circadian variation of the measured variables. All subjects were informed of the purpose, procedure and potential risks of the trials. They provided written consents prior to participation. The study protocol followed the Helsinki Declaration. Clothing ensembles Five vocational clothing ensembles were selected in the study. The characteristics of all five clothing ensembles are described in Table 1. Table 1 Details of clothing ensembles.
180 Code Garment components I T clo I cl clo R e Pa m 2 /W i m nd L short sleeve tee-shirt, briefs, short pants, socks, sports shoes HV short sleeve tee-shirt, briefs, long trousers with reflective materials, socks, shoes MIL jacket, long trousers, short sleeve net tee-shirt, briefs, socks, sports shoes CLM polyamide overall laminated with Goretex membrane, short sleeve tee-shirt, briefs, socks, sports shoes FIRE RB90 firefighting clothes, underwear, short sleeve tee-shirt, briefs, socks, sports shoes L: light clothing; HV: high vision clothing; MIL: military clothing; CLM: climber overall; FIRE: firefighting clothing. I cl, clothing intrinsic thermal insulation; i m, clothing permeability index; nd, nondimensional. Test procedures All clothing, equipment and subjects were weighed on a weighing scale (Mettler-Toledo Inc., Switzerland, precision: ±2 g) during preparation. After the preparation, the subject came into a climatic chamber, and walked on a motorized treadmill (Exercise X Track Elite, Sweden) at 4.5 km/h (i.e., 1.25 m/s). In order to get a steady-state sweat production rate, the subjects were weighed again after 30 min of walking(wang et al., 2011). The heart rate, the rectal (T re ) and skin (T sk ) temperatures were recorded throughout the exposure. Test sessions were terminated when one of the following three criteria was reached: (i) subjects felt the conditions were intolerable and were unable to continue, (ii) the rectal temperature T re reached 38.5 C or (iii) subjects walked 70 min on the treadmill. The subject was weighed again immediately after the exposure. Afterwards, they took off equipment and garments. Each garment was quickly weighed separately after the subject removed it. Right after the subjects were undressed and the measuring equipment was removed, the subject was weighed just wearing briefs and the rectal sensor. Measurements and Calculations The rectal sensor (YSI-401 Yellow Springs Instrument, Measurement Specialties Inc., USA, accuracy ±0.1 C) was inserted by the subject at a depth of approximately 10 cm beyond the anal sphincter. Four thermocouples (NTC-resistant temperature matched thermistors ACC-001,
181 Rhopoint Components Ltd, UK, accuracy ±0.2 C, time constant 10s) were taped (surgical waterproof tape, 3M, USA) on the left side of the human body at four sites, i.e., chest, upper arm, thigh and calf. The mean skin temperature was calculated using the Ramanathan 4-point weighting system(ramanathan, 1964) of 0.3 chest, 0.3 upper arm, 0.2 thigh and 0.2 calf. The rectal and skin temperatures were recorded via a LabVIEW program (National Instruments Corp., USA) with an interval of 15s when the subject started walking on the treadmill. The oxygen uptake was measured with a MetaMax I instrument (Cortex Biophysik GmbH, Germany) for 5 min after 10 min of walking. A heart rate monitor (Sport Tester, Polar Electro Oy, Finland) was worn throughout the exposure. Subjective ratings Subjective ratings of the perceived physical exertion, based on Borg RPE Scale (Borg, 1982), 9-point whole-body thermal sensation (-4= very cold to 4= very hot)(en-10551, 2001)and 4-point skin humidity sensation (0= neutral,1=slightly wet, 2=wet, 3= very wet) were recorded every 10 min during the whole exposure. Test Conditions Two thermal environmental conditions were chosen, 20 C, RH=86 % (WBGT=19.0 C) and 30 C, RH=47 % (WBGT=24.5 C). At WBGT=19.0 C, the subjects performed three trials in clothing ensembles HV, MIL, and CLM. At WBGT=24.5 C, they conducted totally five trials with all five clothing ensembles. The air velocity inside the climatic chamber was controlled at 0.33±0.05 m/s. Statistical analysis Means and SD (standard deviation) during the whole exposure period were reported for dependent variables. Using a SPSS 16.0 (SPSS Inc., Chicago, IL, USA) program, the repeated measures ANOVA was used to determine whether there were significant differences on the metabolism, heart rate, subjective sensations, sweat rate and the evaporative rate for different clothing and thermal environments. The statistical significance was set at p < Results
182 All subjects successfully completed each exercise at eight different test scenarios. The measured and calculated parameters are presented in the following four sections. Metabolism and heart rate The mean metabolic rate and heart rate of all eight subjects were displayed in Table 3. The mean heart rate was about 100 bpm (beats per minute) for all test conditions and no significant difference was observed among those clothing ensembles (p 0.1). Similarly, the two thermal temperatures have no significant effect on the heart rate either (p 0.1). The metabolic rates during walking in clothing ensembles L, HV, MIL and CLM were around 165 W/m 2. In contrast, the metabolic rate in clothing FIRE was significantly higher than other four clothing ensembles (p 0.001). Additionally, the testing temperature has no significant effect on the subject s metabolic rate (p 0.1). Table 3 The metabolic rate and heart rate for all eight test scenarios (mean ± SD) Clothing ensemble WBGT C Metabolism W/m 2 Heart rate bpm HV ±13 95±14 MIL ±7 92±15 CLM ±11 99±15 L ±7 96±14 HV ±12 98±13 MIL ±11 94±11 CLM ±14 108±19 FIRE ±6* 107±17 * p Subjective sensations All subjects had very similar pre-exercise subjective sensations. The post-exercise subjective sensations of all eight subjects were presented in Table 4. The clothing ensemble has significant effects on the three subjective sensations (p 0.05). In contrast, the temperature has significant effects on the thermal and skin humidity sensations, but not on the RPE. Significant differences were detected between the clothing FIRE and other four clothing ensembles on the thermal sensation (p 0.05). Similarly, the skin humidity sensation in clothing FIRE has significant differences with
183 clothing L, HV and MIL (p 0.001). Furthermore, the RPE in clothing FIRE has significant differences with clothing L and HV (p 0.05). However, no significant differences were registered between clothing FIRE and MIL on the humidity sensation and RPE (p 0.1). Table 4 The subjective thermal sensations at the end of the exposures (mean±sd) Clothing WBGT Thermal Skin humidity RPE ensemble C sensation sensation HV ± ± ±2.1 MIL ± ± ±1.6 CLM ± ± ±1.7 L ± ± ±2.2 HV ± ± ±2.4 MIL ± ± ±2.2 CLM ± ± ±1.4 MIL ±0.79* 2.69±0.46* 14.1±2.1 *p Comparison of predicted and observed skin and rectal temperatures The observed rectal and skin temperatures for all eight test scenarios were illustrated in Figures 1a-h. At an environment temperature of 19.0 C WBGT, the mean skin temperatures in clothing MIL and CLM were stable during the last 40-minute exposure, which increased by 0.57 and 1.29 C compared with their initial points. However, the mean skin temperature in clothing HV decreased slightly by 0.1 C. After 70 min exposure, the rectal temperature in clothing ensembles L, HV, and MIL increased by 0.26, 0.33 and 0.45 C, respectively. For clothing ensembles L, HV and MIL at WBGT=24.5 C, the observed skin temperature was also stable during the last 40 min exposure. However, the mean skin temperatures in clothing CLM and FIRE continuously increased with the testing time. The mean skin temperatures in clothing ensembles L, HV, MIL, CLM, and FIRE increased by 1.7, 2.1, 2.1, 2.8 and 3.3 C, respectively. In contrast, the rectal temperatures in clothing ensembles L, HV, MIL, CLM and FIRE increased by 0.32, 0.33, 0.39, 0.48 and 0.82 C, respectively. A PHS model program (Wang et al., 2011) was applied to predict the skin and rectal temperatures for all testing scenarios. Compared with the original
184 source code presented in the international standard ISO 7933(ISO-7933, 2004), the only modification was made on the initial points of rectal and skin temperatures. The initial skin and rectal temperatures in this PHS program were set the same as our observed values for each test condition. The predicted temperature curves for all test conditions were also plotted in Figs 1a-h.
185 Figs 1a-h Predicted and observed mean skin and rectal temperatures for all five clothing ensembles at 19.0 and 24.5 C WBGT. a) HV at WBGT=19.0 C; b) clothing MIL at WBGT=19.0 C; c) CLM at WBGT=19.0 C; d) L at WBGT=24.5 C; e) HV at WBGT=24.5 C; f) MIL at WBGT=24.5 C; g) CLM at WBGT=24.5 C; h) FIRE at WBGT=24.5 C; Tre, mean rectal temperature; Tsk, mean skin temperature; Tre_p, predicted rectal temperature; Tsk_p, predicted mean skin temperature. The PHS model demonstrated good performance on predicted skin temperature in clothing MIL and CLM at both warm and hot environments. However, there was a large discrepancy between the predicted and observed skin temperatures in light clothing such as clothing HV at a high humidity environment, i.e., WBGT=19.0 C. The predicted skin temperature curve showed an initial rate of rise much greater than the experimental data at the first 10 min, and then adopted a relatively constant temperature plateau. The predicted skin temperature after 70 min exposure was 2.01 C greater than the experimental data. On the other hand, the predicted rectal temperature curves in clothing MIL and CLM at the warm humid environment followed closely the observed curves. However, for clothing HV at WBGT=19.0 C, the post-exercise rectal temperature was 0.56 C lower than the observed temperature. Moreover, the predicted curves on the rectal temperature at WBGT=24.5 C in clothing L, HV and MIL also showed good performance. However, as shown in Figure 1g, the predicted rectal temperature curves in clothing CLM rose above the observed curve after about 45 min. Similarly, the predicted rectal temperature curve stayed above the still rising experimental curve after 15 min. Finally, the predicted rectal temperatures in clothing CLM and FIRE at WBGT=24.5 C were 0.92 and 2.12 C greater than the observed data. Sweat and evaporation rates
186 The sweat production rate (g/h) was calculated from the nude body weight differences between pre- and post-exercise. Similarly, the evaporation rate was calculated from the weight differences of the human/clothing system before and after the trial. The sweat and evaporation rates at 19.0 and 24.5 C WBGT were plotted in Figures 2a and 2b. The evaporation rate based on the last 40-min data was also presented. The clothing ensemble and testing temperatures have significant effect on the sweat rate (p , p ). Similarly, the testing temperature also has a significant effect on evaporation rate (p 0.01). However, the clothing ensemble has no significant effect on the evaporation rate (p 1 0.5, p 2 0.5). The predicted sweat rates in clothing MIL, CLM and FIRE at both two moderate warm environments were significantly greater than the observed values (p 0.05). Also, the predicted evaporation rates were significantly underestimated for all test scenarios expect clothing L and HV at WBGT=19.0 C (p 0.05). However, the predicted sweat rates in clothing L and HV were in close agreement with experimental data. Figure 2 The observed and predicted sweat rate and evaporation rate. a) WBGT=19.0 C; b) WBGT=24.5 C; # based on the last 40 min data; *p<0.05. Discussion The clothing thermal properties and environmental conditions such as thermal insulation, evaporative resistance, and air temperature play an important role in determining the human body heat balance. Most vocational clothing ensembles are made to protect the human body against various heat and chemical hazards, however, they may generate serious ergonomic problems (Havenith and Heus, 2004; Coca et al., 2010). The main problem is the added load on the body in terms of weight, but reduced in the mobility might also be a problem because of the garment bulkiness,
187 stiffness and fit (Holmér, 2006). In our study, the clothing ensemble FIRE (total weight: 6.45 kg) was almost 4 times heavier than clothing L, and twice than clothing CLM. The metabolic rate and RPE value of all subjects in clothing FIRE at WBGT=24.5 C increased about 10 % (metabolism: 15 W/m 2 ; RPE: 1.6), which made it significantly different with other 4 clothing ensembles. This finding reconfirmed the conclusions described in previous studies (Holmér, 1995; Dorman, 2007). Yamauchi and Morooka (Yamauchi and Morooka, 2002) studied the effect clothing humidity on the humidity sensation on human subjects. They concluded that the clothing humidity related more to the comfort feeling than the thermal sensation. Furthermore, they found that there was a higher positive correlation between humidity sensation and clothing humidity. Moreover, there were significant correlations between humid sensation and some physiological responses such as the heart rate, the oral temperature, and the mean skin temperature. Fan and Tsang (Fan and Tsang, 2008)investigated the effect of clothing thermal properties on the thermal comfort sensation during active sports. They observed that the thermal comfort sensations during active sports were strongly related to the evaporative resistance and moisture accumulation within clothing. In our study, the permeability index of all five clothing ensembles ranged from 0.20 to The evaporative resistance of all clothing ensembles ranged from 19.8 to Pa m 2 /W. The clothing ensembles CLM and FIRE can be classified as impermeable clothing accordingly (the permeability index of typical outdoor 1-2 layer clothing was around 0.38(Havenith et al., 1999; Holmér, 2006). Such impermeable clothing ensembles could significantly influence the humidity sensation, comfort sensation and thermal sensation of the subjects. The sweat accumulation inside clothing ensembles HV, MIL, and CLM after 70 min under the warm environment were 53, 70 and 127 g, respectively (expressed as the percentage of produced sweat: 25.1, 29.6, and 43.6 %). Similarly, for all clothing ensembles at 24.5 C WBGT, the sweat accumulations were 92, 56, 78, 216 and 364 g (expressed as the percentage of produced sweat: 22.1, 13.5, 17.9, 39.8, and 52.7 %), respectively. No differences in sweat accumulation were registered in clothing ensembles L, HV and MIL at those two thermal environments. However, there was a much higher percentage of sweat accumulation inside clothing ensembles CLM and FIRE. The high sweat accumulation was directly corresponded to the humidity and comfort sensations of the subjects.
188 At a moderate warm environmental condition such as 19.0 C WBGT, the mean skin temperatures of the subjects in clothing ensembles HV, MIL and CLM were relatively stable during the last 40-min walking, fluctuating within 0.1 C. With only a short sleeve tee-shirt covered the upper body in clothing HV, the thermocouple attached on the left upper arm located close to the sleeve opening, which caused the mean skin temperature was much lower than other clothing at the same test environment. Furthermore, the rectal temperature increased slightly throughout the exposure in all three clothing ensembles, the increase became slow at the end of the experiments, however. For impermeable clothing ensembles CLM and FIRE at WBGT=24.5 C, the mean skin and rectal temperatures increased continuously with the time. In this situation, the physiological heat strain could not be compensated enough by the sweat evaporation, convective and radiative heat losses. Furthermore, Sakoi et al. (Sakoi et al., 2006) reported the characteristics of the Required Sweat Rate index and pointed out that the multiple regression formula used for skin temperature prediction cannot reflect all heat transfer characteristics. Although some important modifications based on this index were made afterwards for the present PHS model, our recent study (Wang et al., 2011) has clearly demonstrated that the present PHS model is inapplicable for heavy protective clothing and those tests conducted in very humid environmental conditions. The current PHS model generated relatively conservative data on the duration limited exposure (Smolander et al., 1991) and thus, the worker s productivity is highly reduced. In this study, the prediction curve in clothing HV at WBGT=19.0 C and clothing CLM and FIRE at WBGT=24.5 C reconfirmed those findings. In order to maximize the worker s productivity but keep them safe, it is necessary to revise the current PHS model and extend its applicability. Some empirical equations such as the mean skin calculation equation (Mairiaux et al., 1987; Mehnert, 2000)in the PHS model might be replaced by improved equations. Additionally, further human subject studies might be needed to modify the current PHS model to enhance the prediction accuracy. Conclusions In summary, we assessed five protective clothing ensembles on eight unacclimatized male subject tests at two WBGT levels: 19.0 and 24.5 o C. Comparisons were also made between the experimental data and the predicted values by the current version PHS model. Some important findings are summarized as below:
189 1. The study reconfirmed that the thick and high insulating protective clothing such as firefighting clothing could increase around 10 % of the total metabolic rate compared with light clothing. 2. There were significant differences between the clothing FIRE and other four clothing ensembles on the thermal sensation (p 0.05). Significant differences were registered on humidity sensation between clothing FIRE and clothing ensembles L, HV and MIL (p 0.001). The RPE value in clothing FIRE has significant differences with those in clothing L and HV (p 0.05). However, no significant differences were observed between clothing FIRE and MIL on the humidity sensation and RPE (p 0.1). Moreover, there was a significant difference in sweat rate between clothing FIRE and other 4 clothing ensembles. The predicted sweat rate and evaporation rate in clothing MIL, CLM and FIRE were significantly different with the experimental values. 3. At 19.0 C WBGT, the post-exercise mean skin temperature increased by 0.59 and 1.29 C in clothing MIL and CLM. Similarly, the rectal temperatures in clothing HV, MIL and CLM increased 0.26, 0.33 and 0.45 C, respectively. In contrast, the rectal temperatures in clothing L, HV, MIL, CLM and FIRE at WBGT=24.5 o C, increased by 0.32, 0.33, 0.39, 0.48 and 0.82 C, respectively. The skin temperatures in clothing L, HV, MIL, CLM and FIRE increased by 1.7, 2.1, 2.1, 2.8 and 3.3 C, respectively. 4. The PHS model presented good performance on the predicted mean skin temperature in clothing MIL and CLM at both two moderate warm environments. However, there was a large discrepancy between the predicted and observed skin temperatures in light clothing such as clothing HV at a high humidity environment (WBGT=19.0 C). For high insulating clothing ensembles such as clothing CLM and FIRE, the predicted data on rectal temperature showed highly conservative values. Furthermore, the PHS model demonstrated a weak ability in predicting mean skin temperature for subjects wore light clothing in a high humidity environment, e.g., the clothing L at WBGT=19.0 C. It is thus concluded that the present PHS model is inapplicable for high insulating protective clothing and measurements performed in humid environments. Finally, further work at higher work intensity is needed to revise the PHS model in order to enhance its applicability.
190 Acknowledgements This study would not have been possible without the financial support from VINNOVA (Swedish Governmental Agency for Innovation Systems) R&D funding and the Taiga AB in Varberg, Sweden. We are grateful to volunteers for their participation and perseverance. Conflict of interest The authors declare that they have no conflict of interest.
191 References Allnutt M F and Allan J R 1973 Effects of core temperature elevation and thermal sensation on performance Ergonomics Borg G 1982 Psychophysical bases of perceived exertion Med. Sci. Sports Exercise Cadarette B S, Montain S J, Kolka M A, Stroschein L, Matthew W and Sawka M N 1999 Cross validation of USARIEM heat strain prediction models Aviat Space Environ Med Coca A, Williams W J, Roberge R J and Powell J B 2010 Effects of fire fighter protective ensembles on mobility and performance Appl Ergon Dorman L E 2007 The effects of protective clothing and its properties on energy consumption during different activities Loughborough University: Leicestershire, UK EN Ergonomics of the thermal environment -- Assessment of the influence of the thermal environment using subjective judgement scales European Committee for Standardization: Brussels Epstein Y, Keren G, Moisseiev J, Gasko O and Yachin S 1980 Psychomotor deterioration during exposure to heat Aviat Space Environ Med Epstein Y and Moran D S 2006 Thermal comfort and the heat stress indices Ind. Health Fan J T and Tsang H W K 2008 Effect of clothing thermal properties on the thermal comfort sensation during active sports Text Res J Havenith G and Heus R 2004 A test battery related to ergonomics of protective clothing Appl Ergon Havenith G, Holmer I, Den Hartog E A and Parsons K C 1999 Clothing evaporative heat resistance - Proposal for improved representation in standards and models Ann Occup Hyg Holmér I 1995 Protective clothing and heat stress Ergonomics Holmér I 2006 Protective clothing in hot environments Ind Health ISO Hot environments -- Estimation of the heat stress on working man, based on the WBGT-index International Organization for Standardization: Geneva p 9 ISO Hot environments -- analytical determination and interpretation of thermal stress using calculation of required sweat rates International Organization for Standardization: Geneva p 19 ISO Ergonomics of thermal environment -- analytical determination and interpretation of thermal stress using calculation
192 of predicted heat strain International Organization for Standardization: Geneva Jáuregui E and Soto C 1967 Wet-bulb temperature and discomfort index areal distribution in Mexico Int J Biometeorol Johnson R E 1946 Applied physiology Annu. Rev. Physiol Mairiaux P, Malchaire J and Candas V 1987 Prediction of mean skin temperature in warm environments Eur J Appl Physiol Malchaire J, Kampmann B, Havenith G, Mehnert P and Gebhardt H J 2000 Criteria for estimating acceptable exposure times in hot working environments: a review Int Arch Occup Environ Health Malchaire J, Piette A, Kampmann B, Havenith G, Mehnert P, Holmér I, Gebhardt H, Griefahn B, Alfano G and Parsons K 2001 Development and validation of the predicted heat strain model Ann Occup Hyg Malchaire J B M 2006 Occupational heat stress assessment by the Predicted Heat Strain model Ind. Health Mehnert P, Malchaire, J., Kampmann, B., Piette, A., Griefahn, B., Gebhardt, H Prediction of the average skin temperature in warm and hot environments Eur J Appl Physiol Millard C E and Withey W R 1998 Heat strain in clothed, hypohydrated personnel In ICEE 8. The 8th international conference on environmental ergonomics: San Diego, California, USA pp Parsons K C 2003 Human thermal environments: The Effects of Hot, Moderate and Cold Environments on Human Health, Comfort and Performance Taylor & Francis: Hampshire, UK Ramanathan N L 1964 New weighting system for mean surface temperture of human body Journal of Applied Physiology Sakoi T, Mochida T, Nagano K and Shimakura K 2006 Characteristics and consideration of required sweat rate standard of the previous ISO 7933 J Human Environ System Shibolet S, Lancaster M and Danon Y 1976 Heat stroke: A Review Aviat Space Environ Med 47, Smolander J, Ilmarinen R and Korhonen O 1991 An evaluation of heat stress indices (ISO 7243, ISO/DIS 7933) in the prediction of heat strain in unacclimated men Int Arch Occup Environ Health Stolwijk J A and Hardy J D 1977 Control of body temperature. Reactions to Environmental Agents. The American Physiological Society: Bethesda Tanabe S, Kobayashi K, Nakano J, Ozeki Y and Konishi M 2002 Evaluation of thermal comfort using combined multi-node
193 thermoregulation (65MN) and radiation models and computational fluid dynamics (CFD) Energy Build Wang F, Kuklane K, Gao C and Holmér I 2011 Can the PHS model (ISO7933) predict reasonable thermophysiological responses while wearing protective clothing in hot environments? Physiol Meas Werner J 1989 Thermoregulatory models Scand J Work Environ Health 15 suppl Yamauchi Y and Morooka H 2002 Effect of stimulation strength of clothing humidity on humidity sensitivity Sen-I Gakkaishi

194
Development of Empirical Equations to Predict Sweating Skin Surface Temperature for Thermal Manikins in Warm Environments.
 Development of Empirical Equations to Predict Sweating Skin Surface Temperature for Thermal Manikins in Warm Environments. Wang, Faming; Kuklane, Kalev; Gao, Chuansi; Holmér, Ingvar Published: 2010-01-01
A Comparative Introduction on Sweating Thermal Manikin Newton and Walter
 A Comparative Introduction on Sweating Thermal Manikin Newton and Walter Wang, Faming Published: 2008-01-01 Link to publication Citation for published version (APA): Wang, F. (2008). A Comparative Introduction
The comparison of thermal properties of protective clothing using dry and sweating manikins
 The comparison of thermal properties of protective clothing using dry and sweating manikins Gao, Chuansi; Holmér, Ingvar; Fan, Jintu; Wan, Xianfu; Wu, John YS; Havenith, George Published in: [Host publication
Healthy Buildings 2017 Europe July 2-5, 2017, Lublin, Poland
 Healthy Buildings 2017 Europe July 2-5, 2017, Lublin, Poland Paper ID 0113 ISBN: 978-83-7947-232-1 Measurements of local clothing resistances and local area factors under various conditions Stephanie Veselá
Published in: Proceedings of the 11th International Conference on Environmental Ergonomics
 Using 3D whole body scanning to determine clothing area factor Gao, Chuansi; Kuklane, Kalev; Holmér, Ingvar Published in: Proceedings of the 11th International Conference on Environmental Ergonomics 2005
CLOTHING REAL EVAPORATIVE RESISTANCE DETERMINED BY MEANS OF A SWEATING THERMAL MANIKIN: A NEW ROUND-ROBIN STUDY
 CLOTHING REAL EVAPORATIVE RESISTANCE DETERMINED BY MEANS OF A SWEATING THERMAL MANIKIN: A NEW ROUND-ROBIN STUDY Wang, Faming; Havenith, George; Mayor, Tiago Sotto; Kuklane, Kalev; Leonard, Jean; Zwolinska,
Contact person:
 APPARENT TOTAL EVAPORTAIVE RESISTANCE AND CLOTHING ADJUSTMENT FACTORS AT DIFFERENT HUMIDITIES AND METABOLIC RATES Thomas E. Bernard 1, Victor Caravello 1, Elizabeth A. McCullough 2, Candi D. Ashley 1 1
Interaction effects of radiation and convection measured by a thermal manikin wearing protective clothing with different radiant properties
 Loughborough University Institutional Repository Interaction effects of radiation and convection measured by a thermal manikin wearing protective clothing with different radiant properties This item was
Simulation of perspiration in sweating fabric manikin-walter
 Design and Nature III: Comparing Design in Nature with Science and Engineering 221 Simulation of perspiration in sweating fabric manikin-walter J. Fan Institute of Textiles and Clothing, The Hong Kong
The E ects of Wind and Human Movement on the Heat and Vapour Transfer Properties of Clothing
 PII: S0003-4878(99)00061-7 Ann. occup. Hyg., Vol. 43, No. 5, pp. 347±352, 1999 # 1999 British Occupational Hygiene Society Published by Elsevier Science Ltd. All rights reserved Printed in Great Britain.
Experimental Heated, Breathing and Sweating Manikins. Integrating radiant. Fatigue Lab constructs the. losses. military use. of human body heat
 Assessment of the Thermal Environment Experimental Heated, Breathing and Sweating Manikins George Havenith Professor of Environmental Physiology and Ergonomics Environmental Ergonomics Research Centre
The interaction of clothing. ventilation with dry and evaporative heat transfer of jackets: the effect of air and. vapor permeability
 Loughborough University Institutional Repository The interaction of clothing ventilation with dry and evaporative heat transfer of jackets: the effect of air and vapor permeability This item was submitted
Prediction of Clothing Thermal Insulation and Moisture Vapour Resistance of the Clothed Body Walking in Wind
 Ann. Occup. Hyg., Vol. 50, No. 8, pp. 833 842, 2006 # 2006 The Author 2006. Published by Oxford University Press on behalf of the British Occupational Hygiene Society doi:10.1093/annhyg/mel050 Prediction
A Comparison of Two Methods of Determining Thermal Properties of Footwear
 INTERNATIONAL JOURNAL OF OCCUPATIONAL SAFETY AND ERGONOMICS 1999, VOL. 5, NO. 4, 477-484 A Comparison of Two Methods of Determining Thermal Properties of Footwear Kalev Kuklane Department of Occupational
SCRUB SUITS VS CLEAN AIR SUITS A THERMAL PROPERTIES COMPARISON
 SCRUB SUITS VS CLEAN AIR SUITS A THERMAL PROPERTIES COMPARISON Isabel ABREU; Patrícia RIBEIRO & Maria José ABREU Abstract: In operationg room (OR), the health professionals are exposed to stress situations
Comfort of Clothing. Rajesh Mishra & Jiri Militky Technical University of Liberec Liberec, Czech Republic
 Comfort of Clothing Rajesh Mishra & Jiri Militky Technical University of Liberec Liberec, Czech Republic Comfort Physical comfort - Mechanical Physiological comfort - Transmission Psychological comfort
Healthy Buildings 2017 Europe July 2-5, 2017, Lublin, Poland. Local air gap thickness model for realistic simulation of thermal effects in clothing
 Healthy Buildings 2017 Europe July 2-5, 2017, Lublin, Poland Paper ID 0238 ISBN: 978-83-7947-232-1 Local air gap thickness model for realistic simulation of thermal effects in clothing Agnes Psikuta*,
SBS5225 HVACR I Thermal Comfort. Ir. Dr. Sam C. M. Hui Faculty of Science and Technology
 SBS5225 HVACR I http://ibse.hk/sbs5225/ Thermal Comfort Ir. Dr. Sam C. M. Hui Faculty of Science and Technology E-mail: cmhui@vtc.edu.hk Aug 2016 Contents What is Thermal Comfort? Thermal Environment and
Clothing insulation From Wikipedia, the free encyclopedia
 Page 1 of 9 Clothing insulation From Wikipedia, the free encyclopedia Clothing insulation is the thermal insulation provided by clothing. [1][2] Even if the main role of clothing is to protect from the
Parallel and Serial Methods of Calculating Thermal Insulation in European Manikin Standards
 International Journal of Occupational Safety and Ergonomics (JOSE) 2012, Vol. 18, No. 2, 171 179 Parallel and Serial Methods of Calculating Thermal Insulation in European Manikin Standards Kalev Kuklane
Impact of local clothing values on local skin temperature simulation
 Proceedings of 9 th Windsor Conference: Making Comfort Relevant Cumberland Lodge, Windsor, UK, 7-10 April 2016. Network for Comfort and Energy Use in Buildings, http://nceub.org.uk Impact of local clothing
Testing Services for the Evaluation of. Fabric Systems, Clothing Systems, Sleeping Bag Systems, Bedding Systems, and Personal Cooling Systems (PCS)
") Testing Services for the Evaluation of Fabric Systems, Clothing Systems, Sleeping Bag Systems, Bedding Systems, and Personal Cooling Systems (PCS) Kansas State University Meredith Schlabach Testing Coordinator
Testing Services for the Evaluation of Fabric Systems, Clothing Systems, Sleeping Bag Systems, Bedding Systems, and Personal Cooling Systems (PCS) Kansas State University Meredith Schlabach Testing Coordinator
Research Article Artificial Neural Network Estimation of Thermal Insulation Value of Children s School Wear in Kuwait Classroom
 Artificial Neural Systems Volume 25, Article ID 4225, 9 pages http://dx.doi.org/.55/25/4225 Research Article Artificial Neural Network Estimation of Thermal Insulation Value of Children s School Wear in
FORCED VENTILATION OF PROTECTIVE GARMENTS FOR HOT INDUSTRIES. J.A. Gonzalez, L.G. Berglund, T.L. Endrusick*, M.A. Kolka
 Abstract FORCED VENTILATION OF PROTECTIVE GARMENTS FOR HOT INDUSTRIES J.A. Gonzalez, L.G. Berglund, T.L. Endrusick*, M.A. Kolka Biophysics and Biomedical Modeling Division U.S. Army Research Institute
Assessment of Hypothermia Blankets Using an Advanced Thermal Manikin John P. Rugh 1* and Khalid Barazanji 2
 Assessment of Hypothermia Blankets Using an Advanced Thermal Manikin John P. Rugh 1* and Khalid Barazanji 2 1 U.S. Department of Energy National Renewable Energy Laboratory, Golden, Colorado, USA 2 U.S.
Heat Balance When Wearing Protective Clothing
 PII: S0003-4878(99)00051-4 Ann. occup. Hyg., Vol. 43, No. 5, pp. 289±296, 1999 # 1999 British Occupational Hygiene Society Published by Elsevier Science Ltd. All rights reserved Printed in Great Britain.
The effects of protective clothing on metabolic rate
 Loughborough University Institutional Repository The effects of protective clothing on metabolic rate This item was submitted to Loughborough University's Institutional Repository by the/an author. Citation:
CLI MATE PROTECTION SYSTE M S
 CLI MATE PROTECTION SYSTE M S CLOTHING SYSTEMS ENGINEERED ACCORDING TO PEOPLE S INNATE CHARACTERISTICS AND CLIMATIC FACTORS OUR JOB IS MAKING SURE YOU CAN DO YOURS When Taiga was founded in 1982, the company
The Role of Tests and Manikin in Defining Fabrics Thermal Characteristics
 Ghada Ahmad Mohamad Assistant Professor, Spinning, Weaving, and Knitting Department, Faculty of Applied Arts, Helwan University, Egypt. Abstract: Testing plays an important role in maintaining the competitiveness
Effects of Two Cooling Garments on Post-exercise Thermal Comfort of Female Subjects in the Heat
 Fibers and Polymers 2015, Vol.16, No.6, 1403-1409 DOI 10.1007/s12221-015-1403-0 ISSN 1229-9197 (print version) ISSN 1875-0052 (electronic version) Effects of Two Cooling Garments on Post-exercise Thermal
Performance of Protective Clothing: Global Needs and Emerging Markets: 8 th Symposium
 STP 1462 Performance of Protective Clothing: Global Needs and Emerging Markets: 8 th Symposium Portia Yarborough and Cherilyn N. Nelson, Editors ASTM Stock Number: STP1462 @ ASTM International 100 Barr
TECHNICAL NOTE NO. TN16-1 DATE January 2016 ADA DEVELOPMENT OF MATLAB SCRIPTS FOR THE CALCULATION OF THERMAL MANIKIN REGIONAL RESISTANCE VALUES
 TECHNICAL NOTE NO. TN16-1 DATE January 2016 ADA DEVELOPMENT OF MATLAB SCRIPTS FOR THE CALCULATION OF THERMAL MANIKIN REGIONAL RESISTANCE VALUES DISCLAIMER The opinions or assertions contained herein are
Laboratory assessment of cold weather clothing
 Loughborough University Institutional Repository Laboratory assessment of cold weather clothing This item was submitted to Loughborough University's Institutional Repository by the/an author. Citation:
An evaluation of the thermal protective clothing used by six Australian fire brigades
 University of Wollongong Research Online Faculty of Health and Behavioural Sciences - Papers (Archive) Faculty of Science, Medicine and Health 2009 An evaluation of the thermal protective clothing used
Defense Technical Information Center Compilation Part Notice
 UNCLASSIFIED Defense Technical Information Center Compilation Part Notice ADP012413 TITLE: Prediction of Wind Effects on Cold Protective Clothing DISTRIBUTION: Approved for public release, distribution
School of Health Sciences, University of Wollongong, Wollongong, Australia. Contact person:
 AN EVALUATION OF THE THERMAL PROTECTIVE CLOTHING USED BY SIX AUSTRALIAN FIRE BRIGADES. Pete Kerry, Anne M.J. van den Heuvel, Martin van Dijk, Gregory E. Peoples and Nigel A.S. Taylor School of Health Sciences,
MEASUREMENT OF PHYSIOLOGICAL PROPERTIES OF MILITARY CLOTHING IN SIMULATION OF CLIMATIC CONDITIONS IN SELECTED AREAS OF THE WORLD
 MEASUREMENT OF PHYSIOLOGICAL PROPERTIES OF MILITARY CLOTHING IN SIMULATION OF CLIMATIC CONDITIONS IN SELECTED AREAS OF THE WORLD J. Švecová 1, A. Havelka 2 and L. Nagy 2 1 Department of Logistics, University
Applicability of the Thermal Manikin for Thermal Comfort Investigations
 Szent István University Applicability of the Thermal Manikin for Thermal Comfort Investigations Thesis of PhD Work Zoltán Magyar Gödöllő, Hungary 2011 Doctoral School Denomination: Mechanical Engineering
Measurement Method for the Solar Absorptance of a Standing Clothed Human Body
 Original Article Journal of the Human-Environment System Vol.19; No 2; 49-55, 2017 Measurement Method for the Solar Absorptance of a Standing Clothed Human Body Shinichi Watanabe 1) and Jin Ishii 2) 1)
CHAPTER 6 DESIGN AND DEVELOPMENT OF HOSPITAL BED LINEN
 186 CHAPTER 6 DESGN AND DEVELOPMENT OF HOSPTAL BED LNEN 6.1 NTRODUCTON The bed sheets used in hospitals are made of cotton or polyester cotton blended fabrics, which seems to date from the past centuries.
Testing Cold Protection According to EN ISO 20344: Is There Any Professional Footwear that Does Not Pass?
 Ann. Occup. Hyg., Vol. 53, No. 1, pp. 63 68, 2009 Ó The Author 2008. Published by Oxford University Press on behalf of the British Occupational Hygiene Society doi:10.1093/annhyg/men074 Testing Cold Protection
EVALUATION OF PHYSIOLOGICAL PROPERTIES OF THE FIRST LAYER GARMENT FOR SPORT APPAREL
 EVALUATION OF PHYSIOLOGICAL PROPERTIES OF THE FIRST LAYER GARMENT FOR SPORT APPAREL Antonín Havelka 1, Ladislav Nagy 1 1 Technical University of Liberec, Faculty of Textile Engineering, Department of Clothing
Effect of Hair Style on Human Physiological Responses in a Hot Environment
 Effect of Hair Style on Human Physiological Responses in a Hot Environment Myung-Ju Kim 1, Jeong-Wha Choi 1,2,, Hyung-Kook Lee 3 1 Seoul National University, Seoul, Korea 2 Institute of Human Ecology,
Press information. All wrapped up. Warm outer layers for cold days. 22-Jan EN
 Press information All wrapped up Warm outer layers for cold days 22-Jan-2015 452-EN BÖNNIGHEIM (ri) "There's no such thing as bad weather - just the wrong clothing". Every year, sudden changes in the weather
Professor Alan Hedge, Cornell University 1/22
 1 2 3 4 5 6 7 8 9 Thermal Comfort DEA 3500 - Human Factors: Ambient Environment Thermal comfort scales Thermal comfort and thermal sensation are not the same Thermal sensation depends on skin temperature
Comparisons of Thermal and Evaporative Resistances of Kapok Coats and Traditional Down Coats
 Comparisons of Thermal and Evaporative esistances of Kapok Coats and Traditional Down Coats Wang, Faming Published in: Fibres & Textiles in Eastern Europe Published: 2010-01-01 Link to publication Citation
Room Climate Standard. Thomas Wolf, CSES
 Thomas Wolf, CSES The Challenge TW, CSE 2/ 19 The Motivation Energy vs. room climate conditions 1 C = 1 kj/kg 1 g/kg = 2.5 kj/kg TW, CSE 3/ 19 The Definition Thermal Comfort: That condition of mind which
Non-evaporative effects of a wet mid layer on heat transfer through protective clothing
 Loughborough University Institutional Repository Non-evaporative effects of a wet mid layer on heat transfer through protective clothing This item was submitted to Loughborough University's Institutional
Prediction of WBGT-based clothing adjustment values from evaporative resistance
 Original Article PREDICATION Industrial Health OF 2017, WBGT 55, CAVS 549 554 549 Prediction of WBGT-based clothing adjustment values from evaporative resistance Thomas E. BERNARD 1 *, Candi D. ASHLEY
An integrated approach to develop, validate and operate thermo-physiological human simulator for the development of protective clothing
 500 Original A PSIKUTA Article et al. An integrated approach to develop, validate and operate thermo-physiological human simulator for the development of protective clothing Agnes PSIKUTA 1 *, Barbara
Investigation into Fit, Distribution and Size of Air Gaps in Fire-Fighter Jackets to Female Body Form
 Investigation into Fit, Distribution and Size of Air Gaps in Fire-Fighter Jackets to Female Body Form Nazia NAWAZ, Olga TROYNIKOV*, Kate KENNEDY School of Fashion and Textiles, RMIT University, Melbourne,
INVESTIGATION OF HEAD COVERING AND THERMAL COMFORT IN RADIANT COOLING MALAYSIAN OFFICES
 INVESTIGATION OF HEAD COVERING AND THERMAL COMFORT IN RADIANT COOLING MALAYSIAN OFFICES Neama, S.* Department of Architecture, Faculty of Design and Architecture, Universiti Putra Malaysia, 43400 UPM Serdang,
Defense Technical Information Center Compilation Part Notice
 UNCLASSIFIED Defense Technical Information Center Compilation Part Notice ADP012411 TITLE: A Sweating Agile Thermal Manikin [SAM] Developed to Test Complete Clothing Systems Under Normal and Extreme Conditions
Determination of the Air Gap Thickness underneath the Garment for Lower Body Using 3D Body Scanning
 Determination of the Air Gap Thickness underneath the Garment for Lower Body Using 3D Body Scanning Emel MERT 1,2, Sonja BÖHNISCH 1,3, Agnes PSIKUTA* 1, Marie-Ange BUENO 2, Rene M. ROSSI 1 1 Empa, Swiss
TECHNICAL REPORT NO. T17-10 DATE June 2017 EFFECTS OF HEAT AND MOISTURE TRANSFER PROPERTIES OF FABRIC ON HEAT STRAIN IN CHEMICAL PROTECTIVE ENSEMBLES
 TECHNICAL REPORT NO. T17-10 DATE June 2017 EFFECTS OF HEAT AND MOISTURE TRANSFER PROPERTIES OF FABRIC ON HEAT STRAIN IN CHEMICAL PROTECTIVE ENSEMBLES DISCLAIMER The opinions or assertions contained herein
This document is a preview generated by EVS
 INTERNATIONAL STANDARD ISO 11612 Third edition 2015-07-01 Protective clothing Clothing to protect against heat and flame Minimum performance requirements Vêtements de protection Vêtements de protection
Performance Study of Protective Clothing against Hot Water Splashes: from Bench Scale Test to Instrumented Manikin Test
 Ann. Occup. Hyg., 2015, Vol. 59, No. 2, 232 242 doi:10.1093/annhyg/meu087 Advance Access publication 27 October 2014 Performance Study of Protective Clothing against Hot Water Splashes: from Bench Scale
Calculation of Clothing Insulation by Serial and Parallel Methods: Effects on Clothing Choice by IREQ and Thermal Responses in the Cold
 International Journal of Occupational Safety and Ergonomics (JOSE) 2007, Vol. 13, No. 2, 103 116 Calculation of Clothing Insulation by Serial and Parallel Methods: Effects on Clothing Choice by IREQ and
The Use of 3D Anthropometric Data for Morphotype Analysis to Improve Fit and Grading Techniques The Results
 The Use of 3D Anthropometric Data for Morphotype Analysis to Improve Fit and Grading Techniques The Results Abstract Joris COOLS 1*, Alexandra DE RAEVE 1, Peter VAN RANSBEECK 2, Simona VASILE 1, Benjamin
Influence of Undergarment Structure on the Parameters of the Microclimate under Hermetic Protective Clothing
 Grażyna Bartkowiak Central Institute for Labour Protection - National Research Institute, Department of Personal Protective Equipment ul. Wierzbowa 48, 90-133 Lódź, Poland e-mail: grbar@ciop.lodz.pl Influence
Identifying a suitable method for studying thermal comfort in people s homes
 Identifying a suitable method for studying thermal comfort in people s homes Vireen Limbachiya 1, 2, Keyur Vadodaria 1, Dennis Loveday 1, Victoria Haines 3 1 School of Civil and Building Engineering, Loughborough
INFRA- STRUCTURE C LOT H ING S Y STEM S F O R TH E TO U GHEST CH A LLEN G ES
 INFRA- STRUCTURE C LOT H ING S Y STEM S F O R TH E TO U GHEST CH A LLEN G ES CLOTHING SYSTEMS THAT PROTECT AGAINST FOUL WEATHER AND LOW VISIBILITY For 25 years, we have led the way in developing practical
* Nara Women's University, Nara, Japan Nofer Institute of Occupational Medicine, Lo&, Poland
 THERMOREGULATORY AND CIRCULATORY REACTIONS IN SUBJECTS EXPOSED TO THE SUN AND WEARING WHITE AND BLACK CLOTHING K. Blazejczyk', H. Tokuraz, A. Bortkiewic2, M. Katoz and W. Szymczak3 Institute of Geography
8/2016. Protective clothing for firefighters TIGER MATRIX. 3rd category of Personal Protective Clothing
 8/2016 Protective clothing for firefighters TIGER MATRIX 3rd category of Personal Protective Clothing 1 2 3 Used materials and their technical parameters: Construction No. 1: Outer shell material: Fabric
Effects of clothing ventilation openings on thermoregulatory responses during exercise
 Indian Journal of Fibre & Textile Research Vol. 37, June 2012, pp. 162-171 Effects of clothing ventilation openings on thermoregulatory respoes during exercise X H Zhang, J Li a & Y Y Wang Fashion & Art
Interaction of clothing and thermoregulation
 Loughborough University Institutional Repository Interaction of clothing and thermoregulation This item was submitted to Loughborough University's Institutional Repository by the/an author. Citation: HAVENITH,
ISO INTERNATIONAL STANDARD. Protective clothing for protection against chemicals Classification, labelling and performance requirements
 INTERNATIONAL STANDARD ISO 16602 First edition 2007-12-15 Protective clothing for protection against chemicals Classification, labelling and performance requirements Vêtements de protection contre les
UC Berkeley Indoor Environmental Quality (IEQ)
") UC Berkeley Indoor Environmental Quality (IEQ) Title Thermal adaptation and insulation opportunities provided by different drapes of Indian saris Permalink https://escholarship.org/uc/item/8f10n38d Journal,
UC Berkeley Indoor Environmental Quality (IEQ) Title Thermal adaptation and insulation opportunities provided by different drapes of Indian saris Permalink https://escholarship.org/uc/item/8f10n38d Journal,
Special textiles are the ideal solution for effective protection against harmful UV radiation. Hohenstein Institute
 Press information High tech textiles for security personnel More function and comfort 24-Jul-2012 410-EN BÖNNIGHEIM (dd/ri) Workwear has many requirements to fulfil, including a uniform appearance and
A Novel Approach for Fit Analysis of Protective Clothing Using Three-Dimensional Body Scanning
 A Novel Approach for Fit Analysis of Protective Clothing Using Three-Dimensional Body Scanning Yehu LU a,b, Guowen SONG c *, Jun LI a,b a Protective Clothing Research Center, Fashion Institute, Donghua
Page 6. [MD] Microdynamics PAS Committee, Measurement Specification Document, Women s Edition and Mens Edition, Microdynamics Inc., Dallas, TX, 1992.
![Page 6. [MD] Microdynamics PAS Committee, Measurement Specification Document, Women s Edition and Mens Edition, Microdynamics Inc., Dallas, TX, 1992.](/thumbs/95/123563341.jpg "Page 6. [MD] Microdynamics PAS Committee, Measurement Specification Document, Women s Edition and Mens Edition, Microdynamics Inc., Dallas, TX, 1992.") Page 6 [MD] Microdynamics PAS Committee, Measurement Specification Document, Women s Edition and Mens Edition, Microdynamics Inc., Dallas, TX, 1992. [MONC] Moncarz, H. T., and Lee, Y. T., Report on Scoping
Page 6 [MD] Microdynamics PAS Committee, Measurement Specification Document, Women s Edition and Mens Edition, Microdynamics Inc., Dallas, TX, 1992. [MONC] Moncarz, H. T., and Lee, Y. T., Report on Scoping
Services for Personal Protective Equipment Testing and certification
 Services for Personal Protective Equipment Testing and certification HOHENSTEIN together we make textiles safe. Testing, certification, research and development around the theme of textiles completely
THE COMFORT, MEASURED BY MEANS OF A SWEATING MANIKIN (WALTER TM ), OF CLOTHING CONTAINING DIFFERENT FIBRE COMBINA- TIONS: A PRELIMINARY INVESTIGATION
, OF CLOTHING CONTAINING DIFFERENT FIBRE COMBINA- TIONS: A PRELIMINARY INVESTIGATION") THE COMFORT, MEASURED BY MEANS OF A SWEATING MANIKIN (WALTER TM ), OF CLOTHING CONTAINING DIFFERENT FIBRE COMBINA- TIONS: A PRELIMINARY INVESTIGATION Anton F Botha*, Marguerite E Stoffberg & Lawrance Hunter
THE COMFORT, MEASURED BY MEANS OF A SWEATING MANIKIN (WALTER TM ), OF CLOTHING CONTAINING DIFFERENT FIBRE COMBINA- TIONS: A PRELIMINARY INVESTIGATION Anton F Botha*, Marguerite E Stoffberg & Lawrance Hunter
Biomedical Research 2018; Special Issue: ISSN X Study on the effect of professional sports clothing on sports physiology.
 Biomedical Research 2018; Special Issue: ISSN 0970-938X www.biomedres.info Study on the effect of professional sports clothing on sports physiology. Zhiwei Li 1*, Yong Wang 2 1 Department of Physical Education,
OPTIMIZATION OF MILITARY GARMENT FIT
 OPTIMIZATION OF MILITARY GARMENT FIT H.A.M. DAANEN 1,2,3, A. WOERING 1, F.B. TER HAAR 1, A.A.M. KUIJPERS 2, J.F. HAKER 2 and H.G.B. REULINK 4 1 TNO, Soesterberg, The Netherlands 2 AMFI Amsterdam Fashion
COMPETENCIES IN CLOTHING AND TEXTILES NEEDED BY BEGINNING FAMILY AND CONSUMER SCIENCES TEACHERS
 Journal of Family and Consumer Sciences Education, Vol. 20, No. 1, Spring/Summer, 2002 COMPETENCIES IN CLOTHING AND TEXTILES NEEDED BY BEGINNING FAMILY AND CONSUMER SCIENCES TEACHERS Cheryl L. Lee, Appalachian
Improving Men s Underwear Design by 3D Body Scanning Technology
 Abstract Improving Men s Underwear Design by 3D Body Scanning Technology V. E. KUZMICHEV* 1,2,3, Zhe CHENG* 2 1 Textile Institute, Ivanovo State Polytechnic University, Ivanovo, Russian Federation; 2 Institute
- S P F. NEW CRIZAL FORTE UV. SO SAFE, so CLEAR.
 25 E - S P F EYE-SUN PROTECTION FACTOR NEW CRIZAL FORTE UV. SO SAFE, so CLEAR. everyday protection is essential UV light is a major hazard to the eye UV light has a direct and cumulative impact on eye
REFORM THE QUASI-DRUG APPROVAL SYSTEM
 REFORM THE QUASI-DRUG APPROVAL SYSTEM Reform the Quasi-Drug Approval System YEARLY STATUS REPORT: Progress The Ministry of Health, Labour and Welfare (MHLW) released a model template for ordinary quasi-drug
AFFINITY - A novel system for direct Intrafollicular infusion of liquid solutions containing active ingredients.
 AFFINITY - A novel system for direct Intrafollicular infusion of liquid solutions containing active ingredients. Marina Landau, 1 M.D., Michael Tavger, PhD 1. Dermatology, Wolfson Medical Center, Holon,
Intravenous Access and Injections Through Tattoos: Safety and Guidelines
 CADTH RAPID RESPONSE REPORT: SUMMARY OF ABSTRACTS Intravenous Access and Injections Through Tattoos: Safety and Guidelines Service Line: Rapid Response Service Version: 1.0 Publication Date: August 03,
Skin Temperature and Predicted Discomfort of Women Wearing Sheer Empire Style Dress
 Fibers and Polymers 2016, Vol.17, No.6, 963-970 DOI 10.1007/s12221-016-5911-3 ISSN 1229-9197 (print version) ISSN 1875-0052 (electronic version) Skin Temperature and Predicted Discomfort of Women Wearing
UC Berkeley Indoor Environmental Quality (IEQ)
") UC Berkeley Indoor Environmental Quality (IEQ) Title Versatile Indian sari: Clothing insulation with different drapes of typical sari ensembles Permalink https://escholarship.org/uc/item/1wp225b2 Authors
UC Berkeley Indoor Environmental Quality (IEQ) Title Versatile Indian sari: Clothing insulation with different drapes of typical sari ensembles Permalink https://escholarship.org/uc/item/1wp225b2 Authors
THERMAL MANIKIN AND ITS STABILITY FOR ACCURATE AND REPEATABLE MEASUREMENTS
 ISSN 1726-4529 Int j simul model 15 (2016) 4, 676-687 Original scientific paper THERMAL MANIKIN AND ITS STABILITY FOR ACCURATE AND REPEATABLE MEASUREMENTS Vujica Herzog, N. * ; Zavec Pavlinic, D. *,**
PIROCTONE OLAMINE AND ITS MONOETHANOLAMINE SALT
 SCCNPF/0525/01 OPINION OF THE SCIENTIFIC COMMITTEE ON COSMETIC PRODUCTS AND NON-FOOD PRODUCTS INTENDED FOR CONSUMERS CONCERNING PIROCTONE OLAMINE AND ITS MONOETHANOLAMINE SALT Colipa n P59 adopted by the
MATERIAL SAFETY DATA SHEET
 Page 1 of 5 Procter & Gamble Household Care Division Ivorydale Technical Center 5299 Spring Grove Avenue Cincinnati, OH 45217-1087 MATERIAL SAFETY DATA SHEET MSDS #: CT: FH/O/2005/ASAM-6CCNRJ Issue Date:
THE REPRESENTATION OF THE INFLUENCE OF THE BRITISH IMPERIALISM TOWARDS INDIAN SOCIETY IN RUDYARD KIPLING S KIM
 THE REPRESENTATION OF THE INFLUENCE OF THE BRITISH IMPERIALISM TOWARDS INDIAN SOCIETY IN RUDYARD KIPLING S KIM (A POSTCOLONIAL STUDIES) THESIS Submitted as a Partial Fulfillment of Sarjana Humaniora Degree
Clothing Physiological Properties of Cold Protective Clothing and Their Effects on Human Experience
 Tampere University of Technology Clothing Physiological Properties of Cold Protective Clothing and Their Effects on Human Experience Citation Jussila, K. (2016). Clothing Physiological Properties of Cold
Higher National Unit Specification. General information for centres. Fashion: Commercial Design. Unit code: F18W 34
 Higher National Unit Specification General information for centres Unit title: Fashion: Commercial Design Unit code: F18W 34 Unit purpose: This Unit enables candidates to demonstrate a logical and creative
FINAL DRAFT UGANDA STANDARD
 FINAL DRAFT UGANDA STANDARD FDUS EAS 377-1 First Edition 2013-mm-dd Cosmetics and cosmetic products Part 1: List of substances prohibited in cosmetic products Reference number FDUS EAS 377-1: 2013 UNBS
Think Before you Ink: Modeling Laser Tattoo Removal
 Think Before you Ink: Modeling Laser Tattoo Removal BEE 453 May 1, 2008 Katherine Cumnock, Leigh Gerson, Jacqueline Stroncek, and Sarah Yagerman Table of Contents 1.0 Executive Summary. 3 2.0 Introduction..
Heat Gain From Thermal Radiation Through Protective Clothing With Different Insulation, Reflectivity and Vapour Permeability
 International Journal of Occupational Safety and Ergonomics (JOSE) 2010, Vol. 16, No. 2, 231 244 Heat Gain From Thermal Radiation Through Protective Clothing With Different Insulation, Reflectivity and
NTC Project S02-CD01 (formerly I02-E01)
") 1 Project Title: A Strategic Model for Functional Protective Clothing Project Team: Leader: Gang Sun, Division of Textiles and Clothing, UCD Email: gysun@ucdavis.edu Phone: 530-752-0840 Members: You-Lo
1 Project Title: A Strategic Model for Functional Protective Clothing Project Team: Leader: Gang Sun, Division of Textiles and Clothing, UCD Email: gysun@ucdavis.edu Phone: 530-752-0840 Members: You-Lo
Clothing is worn for various reasons. The reasons most
 Research Paper Asian Journal of Home Science December, 211 Volume 6 Issue 2 :11212 Protective clothing for pesticide applicators and other agricultural activities of farm families GEETA MAHALE, SHAMEEMBANU
LIGHTER WEIGHT MORE WARMTH ENHANCED FLEXIBILITY. A New Generation of Flame Resistant Outerwear Fabrics
 LIGHTER WEIGHT MORE WARMTH ENHANCED FLEXIBILITY A New Generation of Flame Resistant Outerwear Fabrics LIGHTER WEIGHT MORE WARMTH ENHANCED FLEXIBILITY 3M Thinsulate Insulation FR Quilted to Westex Westex,
SAFETY DATA SHEET ANTI-BORAX No. 2 DATE REVISED: January 1, 2016
 SAFETY DATA SHEET ANTI-BORAX No. 2 DATE REVISED: January 1, 2016 Product Name: Anti-Borax No. 2 Manufacturer: Superior Flux & Mfg. Co. 6615 Parkland Blvd. Cleveland OH, 44139 Emergency Phone Number: 1-800-424-9300
Improvement in Wear Characteristics of Electric Hair Clipper Blade Using High Hardness Material
 Materials Transactions, Vol. 48, No. 5 (2007) pp. 1131 to 1136 #2007 The Japan Institute of Metals EXPRESS REGULAR ARTICLE Improvement in Wear Characteristics of Electric Hair Clipper Blade Using High
CSR, Sustainability, Ethics & Governance
 CSR, Sustainability, Ethics & Governance Series Editors Samuel O. Idowu, London Metropolitan University, Calcutta House, London, United Kingdom René Schmidpeter, Ingolstadt, Germany For further volumes:
An overview of Cochin Ceramics in Taiwan with an emphasis on the influence of Hong Kun-Fu and his school s to 1980s
 University of Wollongong Research Online University of Wollongong Thesis Collection 1954-2016 University of Wollongong Thesis Collections 2008 An overview of Cochin Ceramics in Taiwan with an emphasis
Mass Customization Methodology for Footwear Design
 Mass Customization Methodology for Footwear Design Yifan Zhang 1, Ameersing Luximon 1, Xiao Ma 1, Xiaoling Guo 2, and Ming Zhang 3 1 Institute of Textiles and Clothing, The Hong Kong Polytechnic University,