Does Fast Fashion Increase the Demand for Premium Brands? A Structural Analysis
|
|
|
- Jody Houston
- 5 years ago
- Views:
Transcription
1 Does Fast Fashion Increase the Demand for Premium Brands? A Structural Analysis Zijun (June) Shi 1, Param Vir Singh, Dokyun Lee, Kannan Srinivasan (Preliminary draft. Please do not cite without the authors permission.) Abstract Erosion of high-end fashion brands by fast fashion copycats (e.g., Zara, Forever 21) has raised attention from industry insiders and policymakers, demonstrated by unceasing legal attempts to try to get fashion designs covered by copyright. This paper develops a dynamic structural model of fashion choices of brands and styles to investigate the implication of prohibiting fashion copycats, with the help of user-generated data from fashion-specific social media and deep learning methods on image analytics. We find that copycats can enhance high-end brands demand, contrary to conventional wisdom, due to several novel mechanisms: first, the affordability of mixing low-end copycats with highend brands boosts demand for high-end brands from financially constrained consumers; second, good styles from low-end brands can help a consumer to build up his popularity/likeability, which increases his value for high-end brands and reduces the cost. Substantively, our results shed light on copyright enforcement and have implications on how fashion brands should react to copycats. Methodically, we developed a framework to analyze consumer choices where visual features are important product attributes and peer feedback hugely affects the decision-making process. 1 This paper is based on the third essay of Zijun (June) Shi s dissertation. Zijun (June) Shi is a PhD candidate in Marketing, Tepper School of Business, Carnegie Mellon University. Param Vir Singh is the Carnegie Bosch Associate Professor of Business Technologies, Carnegie Mellon University. Dokyun Lee is an Assistant Professor of Business Analytics, Carnegie Mellon University. Kannan Srinivasan is the H.J. Heinz II Professor of Management, Marketing and Business Technologies, Carnegie Mellon University.
2 1. Introduction The global fashion industry has reached an estimated value of 3 trillion dollars. 2 Traditional luxury fashion brands, such as Gucci, Prada, and Louis Vuitton, have maintained a strong position within the industry, backstopped by the increasing demand from developing economies such as China. At the same time, fast fashion brands such as Zara, Forever 21, and H&M have been storming the globe with their versatile styles and low price. The path to success of these fast fashion brands, however, is nothing short of controversy. Every year, large fast fashion chains spew close-to-the-runway originals at lightning speed. On the one hand, the high-end brands, believing these copycats will steal their customers and hurt their profitability, spare no effort in fighting back by launching lawsuits against them. 3 On the other hand, high-end brands may not face any threat if their consumers and those of fast fashion brands are different segments with variant values of brands and styles. In addition, lawmakers tend to view the utilitarian nature of clothing and fashion as more important than its artistic and stylistic purposes; therefore fashion designs are not under the protection of copyright law. 4 In spite of this tension on the enforcement and effects of copycats, the effect of fashion copycats on high-end brands remains empirically unclear. In this paper, we estimate the impact of low-end copycats on the demand for high-end brands. We develop a dynamic structural model of individual consumer s fashion choices, which allows for counterfactual analysis of alternative copyright policies against copycats. Contrary to the conventional wisdom, we find that prohibiting low-end copycats can decrease the demand of high-end brands significantly. We find novel mechanisms contributing to this result, which are distinct from the promotional effect documented in the counterfeit literature (e.g., Qian, 2014): first, fewer style choices from low-end brands would limit the mix-and-match choices for consumers and put them on greater financial constraint to get a satisfactory ensemble of clothes, resulting in them buying less high-end brands; second, the lack of good styles from low-end brands will make it harder for consumers to build up their popularity/likeability, which limits the For example, 4
3 complementary value of high-end brands. As a result, consumers adopt less high-end brands. Our findings suggest that the above-mentioned market expansion effect dominates the competition effect. Other counterfactual analyses examine the consequence if the brand or peer feedback cannot be seen, which is the case for many other social medium and offline markets. We overcome substantial technical and empirical challenges to obtain these results. Traditionally, there are two challenges to studying the micro-level consumer choices of fashion goods. First, fashion styles are not quantifiable. Second, individual-level choices on fashion brands and styles across a large pool of brands are not available. In this paper, we employ stateof-the-art deep learning techniques to quantify fashion styles from fashion images. We overcome the second challenge by studying the choices over brands and styles for fashion conscious consumers on social media. Nowadays, fashion is one of the most popular contents generated by users on social media (Hu et al. 2014). More and more fashion consumers post what they wear online, and importantly, these social media users become trendsetters and influence a large number of other fashion consumers. 5 Therefore, investigating how these consumers make choices on brand and style can help us understand the market demand of fashion goods. Our data is from a large online fashion-sharing platform where users post their fashion pictures and evaluate others pictures. The data comprise active users and fashion posts and span over three years. We account for consumer heterogeneity and estimate the structural model following a Hierarchical Bayesian framework. Substantively, our results have implementable policy implications to both managers as well as policymakers. Managerially, we provide novel insights on how copycats can help the high-end brands, which guide their product strategy. In fact, some high-end brands have started to produce their own low-end frugal version of similar styles, consistent with the first mechanism of copycat effects in our findings. Moreover, for fashion companies, understanding how fashion consumers value brands and styles can help managers infer the market demand and make the optimal investments in branding and product design. From the policy-making perspective, we provide novel insights on the potential consequence of alternative copyright policies for fashion designs. More generally, our findings speak to the debate on whether copyright or patent protection 5
4 encourages or discourages innovation in the fashion industry: with more demand brought by low-end copycats, companies can get more money to invest in innovation, which may lead to more creative designs for the entire fashion market. This paper also contributes methodologically and theoretically. Methodologically, we make two contributions. First, we develop a framework to analyze consumer choices where visual features are important product attributes and other people s opinions heavily affect the decision-making. Second, we use deep learning and image processing techniques to quantify fashion styles to make the analysis of fashion style choices possible. Theoretically, our findings provide new insights on how copycat products can benefit the original brands, which also apply to the cases of counterfeits and pirated goods if consumers have mix-and-match choices and popularity concern. The rest of the paper is organized as follows. In Section 2, we review the literature related to this paper. Section 3 presents the raw data, visual feature extraction, and exploratory analysis. Section 4 describes our model. We illustrate the identification and estimation strategy in Section 5. We report the estimated results in Section 6, followed by the counterfactual analysis in Section 7. Section 8 concludes. 2. Literature Review Our study relates to marketing and economics literature on branding, counterfeits and piracy, conspicuous good consumption, as well as the literature on machine learning methods and applications. As we seek to examine the brand value and style value for fashion goods, our paper is related to the marketing literature on branding (e.g., Borkovsky et al., 2017; Goldfard, 2009; Keller & Lehmann, 2006; Kamakura & Russell, 1993). More recently with unstructured data, Nam et al. (2017) investigate the qualitative brand information harvested from social tags in the textual form. Liu et al. (2018) study consumers brand perception on social media using visual data. In this paper, we focus on fashion goods, specifically clothing. We examine how consumers value brands versus styles, and how copycat styles affect the demand of premium brands measured by the units of clothing items adopted in the social media posts.
5 This paper relates to the literature of counterfeits and piracy (e.g., Qian, 2014; Ma et al., 2016; Oberholzer-Gee & Strumpf, 2007; Smith & Telang, 2009), which provided evidences of both cannibalization and promotional effects of counterfeits (pirated goods) on the original. In contrast, copycats and counterfeits are fundamentally different. Counterfeits copy not only the style or content but also the trademark (i.e., the brand logo), therefore they violate the trademark law. However, copycats do not copy the brand logo and are typically legal. Therefore, counterfeits can benefit the original brand by improving the awareness of the brand (i.e., promotional effect), but copycats cannot directly give consumers information about the original brands. Studies that examine the market response of copycats include Horen and Pieters (2012) and Wang et al. (2018). Horen and Pieters (2012) conducted lab experiments and survey studies at a grocery context to demonstrate how copycats can gain or lose from their resemblance to the original brands, but they remain silent about how copycats affect the demand of the original brands. Wang et al. (2018) examine the aggregate impact of copycat mobile apps on the demand of original apps. They find that deceptive and low-quality copycat apps may positively affect the demand of the original app, implying the existence of the promotional effect. In contrast, fashion goods are fundamentally different from grocery and mobile apps, in the sense that consumers mix and match multiple clothing items and peer feedback plays an important role. Moreover, as will be shown in this paper, our micro-level study specifies new mechanisms on how copycats can benefit premium brands, unlike the traditional promotional effect. Various theoretical works have investigated fashion firms strategies on information disclosure (e.g., Yoganarasimhan, 2012), competitive pricing (e.g., Amaldoss & Jain, 2005), given consumers dual needs of conformity and differentiation in conspicuous consumption (Brewer, 1991). Accordingly, the consumer tradeoff between expressing individuality and conforming to others opinions/likes, related to self and public self-consciousness for social behaviors in psychology (Fenigstein et al., 1975). Though people have heterogeneous underlying preferences, Bernheim (1994) shows that when status is very important relative to intrinsic utility, some people will conform to a single standard of behavior. To our knowledge, this is the first empirical research examining consumers conspicuous consumption while incorporating both their intrinsic preferences and the impact of others opinions. To extract and quantify the styles of fashion goods, we need to analyze visual data by referring to machine learning literature for image analytics. Specifically, we apply support vector machine
. 3.")
6 (SVM), support vector regression (SVR), Fast R-CNN (Girshick, 2015), and transfer learning using Siamese CNN (Hadsell et al., 2006; Veit et al., 2015) to extract clothing style features (i.e., compatibility and distinctiveness) and user appearance features (i.e., facial attractiveness and body BMI). 3. Data The research context in this paper is the world s largest online fashion sharing community, 6 designed for users to post their own fashion photography, featuring themselves and their outfits. It shares similar features with other photo-based social media except that the content is restricted to fashion. More importantly, the website features a special function: a user tags the brand of the fashion items in his/her posted picture. Therefore, the brand information is clearly listed beside the fashion look 7 and can be seen by others. Figure 1 shows what a fashion post looks like on the website. Figure 1. Example of a Fashion Post LIKE 6 The company was launched in As of July 2017, there are more than 6 million users registered. 7 We use fashion look to refer to a picture.
7 We collect individual-level historical data from August 2013 to August The data set contains the entire history of fashion content generation for a random sample of 10,262 users 8 who registered after August 2013 and posted at least once. For each fashion look, we collect the image data, the brands for the clothing items, the time stamp, as well as how many likes the picture has attracted. For each user, we also observe his/her age from the brief biography. The gender information is not directly observable, and we will predict the gender from their picture in section Table 1 shows the summary statistics for these users and their fashion posts. We can see that the standard deviation is large relative to the means, and the measures have skewed distribution. A small group of people has lots of posts and likes, whereas many others post very few. This observation is similar to that of most social media platforms. Table 1. Descriptive Statistics (a) User-level summary statistics #posts #Cumulative likes #Following Age mean Std min Median max (b) Post-level summary statistics Mean Std. Min Median Max #likes Note: # denotes the count of. Brand Categorization. Following Ha et al. (2017), we group the fashion brands into three categories: fast fashion (high street), designer, and mega couture. 9 The categorization is 8 We use fashion bloggers and users interchangeably throughout the paper. 9 The original categorization also includes small couture brands, but there is only one observation of such brand in our data. So we consider only three categories.
8 according to domain experts in the fashion industry, based on brand identity and price ranges. We show some examples of each brand category in Table 2. Table 2. Brand Categorization Brand Categories Level 1: Fast Fashion (High Street) Level 2: Designer Level 3: Mega Couture Examples Zara, H&M, Forever21 Kate Spade, Coach, Michael Kors Gucci, Prada, Chanel 3.1. Feature Extraction from Images For a fashion look, we focus on two key aspects of visual features that can affect one s utility: the clothing styles and the appearance of the users. 10 We describe how we extract and measure the clothing styles in and user appearance in Clothing Styles In light of fashion satisfying consumers social needs for group cohesion and differentiation (Simmel, 1904) and domain experts opinion from well established fashion magazines, at a high level, two style features that are particularly relevant for fashion goods: compatibility and distinctiveness. Compatibility speaks to the combination of clothing items from different categories (e.g., shirts versus pants), whereas distinctiveness measures how visually differentiated each item is from others within the same category. We abstract away from more granular style factors (e.g., color, texture) and capture the styles at a high level, because those granular factors can also be described or evaluated according to compatibility and distinctiveness. Below we explain how we extract these two style features from the fashion looks. 10 On the blogging platform, the user himself/herself is the model in the picture. One account consistently posts the account owner s fashion look.
9 Figure 2. Steps of Clothing Style Features Extraction Clothing Item Detection (Fast R-CNN) Embedding in the Style Space (Siamese CNN) Develop measures of compatibility and distinctiveness To measure fashion styles, we first need to detect or identify the clothing items in each fashion look. We follow the approach of the DeepFashion project by Liu et al. (2016). The method is based on the application of Fast Region-based Convolutional Neural Network (Fast R-CNN) (Girshick, 2015). A Fast R-CNN network takes an image and a set of object location proposals as inputs. It learns to classify objects and refine their spatial locations jointly. We adopt the network architecture of DeepFashion, which was trained on the largest and most comprehensive clothes dataset to date, annotated with clothing landmarks and categories. For each fashion look, we extract only the clothing items, which are the most visually dominating items in a picture. Most accessories are too small to be precisely detected, so we do not include them in the analysis in this paper. We keep the cropped items (upper and bottom) if the confidence scores are higher than some threshold. 11 If the detector cannot separate the top and bottom items, we treat the clothes as full-body outfits whose compatibility is assigned an average score of the fashion looks posted during the past three months (same length as a season). After we detect the clothing items, we can proceed to measure compatibility and distinctiveness for the fashion looks. 11 We tried 0.7, 0.8, and 0.9 for robustness checks.
10 Compatibility Among a large number of fashion looks, we would like to know what clothing items go well together. We adopt a deep learning approach to learn a feature transformation from images of clothing items into a latent space that represents compatibility. We use a Siamese convolutional neural network architecture (Siamese CNN) (Hadsell et al., 2006), where training data are pairs of items that are either incompatible or compatible. To measure compatibility, we first initialize the model with weights trained on two million pairs of labeled pairs collected from the purchase data of fashion goods on Amazon.com (Veit et al., 2015). As purchasing two items together may not necessarily mean the consumers treat the items as compatible, we further collect an additional training dataset by conducting a survey on Amazon Mechanical Turk (henceforth AMT). We directly ask survey respondents opinion on compatibility of randomly selected pairs of items. With transfer learning, we fine-tune the deep neural network with three thousand pairs of responses (compatible versus incompatible) from the survey to improve the measure of compatibility. Please see the appendix for the survey design. The abstraction of Siamese CNN architecture is shown in Figure 3. Essentially, it learns a feature transformation f: I X from the image space I (i.e., raw representation of images) to the style space X (i.e., another representation that captures the style features). In the style space, compatible items are closer together, and incompatible items are farther away. Then, we can use the distance between two items locations in the style space to measure how compatible they are. In Figure 3, I and I are the inputs of two clothing items from different categories (top and bottom), x and x are vector representations in the style space, y is the label of data (either compatible or incompatible), and θ is the set of parameters that specify the neural network, which we need to estimate.
 + L x, x (, ) The first term L penalizes when a compatible pair is too")
11 Figure 3. Abstraction of Siamese CNN Architecture The loss function L θ is a contrastive loss and can be expressed as: L θ = L x, x (, ) + L x, x (, ) The first term L penalizes when a compatible pair is too far apart, and the second term L penalizes when an incompatible pair is too close compared to some margin. As illustrated in Figure 4, the embedding of items in the style space are vectors of dimension 256. Following Veit et al. (2015), we measure the compatibility between two items using L norm. The architecture of the CNN in Figure 3 is based on one of the most successful network architectures, GoogLeNet (Szegedy et al., 2015), augmented with a 256-dimension fully connected layer Distinctiveness We measure the distinctiveness of a clothing item by calculating how visually different the item is from all the other items in the same category. Specifically, we use the embedding in the style space to represent each clothing item s style and calculate the average style for items posted in the past three months (a season), to account for the fact that one style could be distinctive this season but may not be distinctive later on. The distinctiveness of one item is measured by L norm between its style embedding and the average style. This is in a similar spirit to the creativity concept from Toubia and Netzer (2017).

 Predict facial attractiveness (SVM) 3.1.2.1. Facial attractiveness Predict BMI (SVR) Predict Gender (SVM) The first step is to crop the face and get a vector representation of the face.")
12 Figure 4. Illustration of Compatibility Feature Extraction Fast R- CNN Siamese CNN User Appearance For the model styles, we examine the face and body features, specifically the facial attractiveness and body mass index. Figure 5. Steps of Model Styles Extraction Face Detection Embedding for each Face (Amos et al. 2016) Predict facial attractiveness (SVM) Facial attractiveness Predict BMI (SVR) Predict Gender (SVM) The first step is to crop the face and get a vector representation of the face. We follow the deep neural network implementation by the Open Face project (Amos et al., 2016). This architecture was trained for face recognition, providing a 128-dimensional intermediate layer that represents a low dimensional embedding of any face image. The first step is to get the low dimensional features generated using the deep neural network implementation. Then we need to train a supervised learning model to predict attractiveness. Our training data consist of three thousand images with attractiveness scored on a 1 to 7 scale, where
13 1 means the face is the least attractive and 7 represents the highest value of attractiveness. Each image is labeled by five Amazon mechanical turkers. We take the average of the five ratings for each image as its final rating. Given the continuous nature of the resulting rating, we train a Support Vector Regression (SVR) model that learns the relationship between the 128- dimensional image features and the attractiveness rating. The model achieves high prediction accuracy with a mean absolute error of 0.66 on the test sample Body feature We measure BMI to capture the users body feature. The training data contains 4206 images of faces with true BMI information, made available by Kocabey et al. (2017). These images are collected from Reddit posts linking to the imgur.com service. With the training data, we first crop the faces and get the embedding of 128 dimensions. Then, with the face embedding as the input and BMI (ranging from 11.5 to 50.8) as the output, we again train an SVR model that learns the relationship between the face image feature and the BMI. Eventually, we can predict BMI for a given fashion look, according to the face detected from the fashion look. The model has good performance with a mean absolute error of Gender information enhancement The gender information for approximately 50% bloggers is not shown on the website. As we also want to know the gender effect, we employ SVM to predict gender from the cropped face images. As a result, we get gender information for 97% bloggers in the whole sample, with 92.89% accuracy on prediction Results of Feature Extraction The objective of the Siamese CNN is to project compatible pairs close together and incompatible pairs far away. Figure 6 plots the distribution of distances for compatible and incompatible pairs for both before and after training for transfer learning. The plots show that the fine-tuned neural network separates the two categories with a greater margin and indicates that the network learned to separate compatible from non-compatible clothing items.

, the commonly used performance measure mean absolute error (MAE) is reported for the hold-out sample.")
14 Figure 6. Distribution of Distances for Compatible and Incompatible Pairs (a) Before Training (b) After Training Table 3. Performance of User Features Extraction Facial Attractiveness BMI Gender MAE Accuracy % Table 3 reports the performance of the feature extraction tasks on facial attractiveness, BMI, and gender. For SVR task (extracting face attractiveness and BMI), the commonly used performance measure mean absolute error (MAE) is reported for the hold-out sample. Accuracy is reported for the binary classification tasks. In Table 4, we show both high and low score examples of the extracted features, resulting from our trained learning models. Table 5 shows the summary statistics for the style features we extracted from the images.


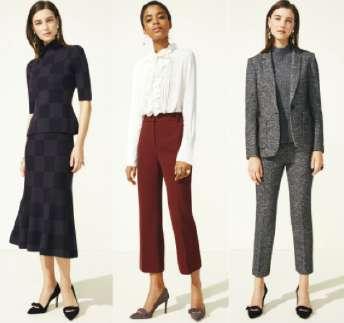


15 Table 4. Example Photos for the Extracted Style Features Low Score High Score Facial Attractiveness Body Feature (BMI) Compatibility Distinctiveness
16 Table 5. Summary Statistics for the Extracted Style Features Variable Mean Std. Dev. Min Max Facial Attractiveness Body BMI Compatibility Distinctiveness Exploratory Data Analysis Users Brand and Style Choices After extracting the style features, we can examine the distribution of styles of fashion looks across the three brand levels to see if the style options are different for each brand level. The boxplots in Figure 7 and the summary statistics in Table 6 show that low-end brands also have pretty good styles, and the style distribution is not much different across brand levels. Therefore, for those who cannot afford luxury brands, there are always substitutes that can provide high-end styles available at lower prices. Figure 7. Boxplots of Styles across Brands
17 Table 6. Summary Statistics at Brand-level Fast Fashion (High Street) Brands (Adopted in 99.79% looks) #item face BMI age gender compatibility distinctiveness #likes mean Std Designer Brands (Adopted in 3.05% looks) mean Std Mega Couture Brands (Adopted in 2.00% looks) mean Std We also see from Table 6 that the vast majority of fashion looks contain fast fashion brands. It implies that users tend to use at least one fast fashion item to make the whole ensemble look good. Table 7 shows how users mix and match brands from the three brand categories. For fashion looks that adopt mega couture brands, more than 80% of them also adopt fast fashion brands. For those using designer brands, more than 86% of them mix with fast fashion brands. The data evidence shows the economic significance and importance of consumers mixing and matching behavior in fashion choices. Table 7. Mix-and-match in Fashion Looks Using Higher-end Brands (a) For looks adopted mega couture brands Only Mega Couture Mega Couture & Mega Couture & All three Fast Fashion Designer Percentage 4.6% 80.15% 0.37% 14.89% (b) For looks adopted designer brands Only Designer Designer & Fast Designer & Mega All three Fashion Couture Percentage 3.58% 86.40% 0.24% 9.77%
18 The Impact of Popularity on Choices and Inter-temporal Tradeoff To understand how consumers choose brand and style, we need to account for a factor that may strongly affect consumers fashion decision in our research context. That is, users are concerned about popularity or peers likes. When a user decides whether and what to post, her level of popularity plays a big role. First, being popular can help reduce future cost, given the fact that many popular fashion bloggers are hired by fashion companies and paid to post instead of paying for what they wear. Second, the incentives for posting on social media (Lee et al., 2015) are typically social interaction and self expression, a user may derive higher utility from a given post when she is more popular and has more people watching or following. Therefore, a blogger may be strategic and forward-looking, in the sense that posting to attract others likes to build up popularity today can help improve future utility because there would be a larger audience for future posts, as well as lower cost for future posts. In other words, when making a post decision, a blogger considers not only the current period s utility, but also the future utility. Even though posting may be worse than not posting in the current period, she may still post because it builds up popularity and the blogger can gain much more in the future. We have explained that the discrete choice of posting is dynamic as popularity affects one s utility of posting. Moreover, a user also faces inter-temporal tradeoff when making the brand and style choices. Because the brand and style choices affect peer likes a post can attract, but the best choices for attracting likes and building up popularity may not be the choices to satisfy one s own per-period intrinsic preference. When one is not that popular, she may focus on attracting peer likes and less on self-intrinsic taste. In comparison, a popular blogger can make style and brand choices subject to less financial constraint and focus more on expressing her intrinsic fashion tastes. An ideal measure of popularity is the number of followers. As we do not observe the number of followers for each user across time, we use the cumulative sum of likes ( SumLike, henceforth) a person has gotten from previous posts as a good proxy for his/her popularity. Figure 8 shows the positive linear relationship between SumLike and the number of followers at a snapshot time Aug 1st, The correlation between SumLike and the number of followers by the time Aug 2017 is 0.85, while that between the average number of likes and number of followers is 0.55.
19 Therefore, we choose SumLike as a proxy measure for one s popularity or, more generally, the exposure one may get when posting a new fashion look. Figure 8. Followers versus Likes Table 8. Popularity Affects Decisions on Fashion Look VARIABLES DV: Brand 1 DV: Brand 2 DV: Brand 3 DV: Compatibility DV: Distinctiveness Popularity * ** 0.292*** ( ) ( ) ( ) (0.0628) (0.0449) Observations 18,957 18,957 18,957 18,957 18,957 R-squared Note: Fixed effects at individual level; Robust standard errors, clustered at individual level. *p<0.01;**p<0.001;***p< In Table 8, we show the results of five separate regressions to see how popularity up to period t 1 affects one s choice of brands and styles in period t. We can see that when bloggers become more popular, they will post more mega couture brands but fewer fast fashion brands, echoing the cost decreasing effect of being popular. Moreover, they further improve the style, implying that the marginal return of improving style is higher when more people are watching.
20 Incentives of Posting on Social Media People post on social media for different reasons: self-expression, social interaction, archiving, escapism, and so on (Lee et al., 2015). Below is the scatter plot of the number of posts and average likes for each user s posts. We can see that those who post more do not necessarily get more likes than users who post less. Some users posts on average attract more than four hundred likes but the users post only around ten times, whereas other users posts get few likes but the users post hundreds of times. Therefore, we hypothesize that the users utility of posting is not driven only by others likes or opinions; they may also derive utility from other channels. For example, an individual might enjoy expressing herself through posting a fashion picture, or she wants to attract those who have the same tastes. In these cases, getting likes is not the primary goal. As a result, when modeling bloggers decision processes, we adopt a general utility functional form, which captures not only the impact of others likes but also bloggers intrinsic utility derived from the brand and style choices. Figure 9. Scatterplot of Posts and Likes However, with the above exploratory analysis, it is still not clear how consumers value brands and styles, and how substitutable brands and styles are. Can good styles from low-end brands compensate for the utility loss from not being able to get the high-end brand with relatively worse styles? We proceed to answer this question by modeling blogger decisions at the microlevel in the next section.
21 4. Model The timing of the events is illustrated in Figure 10. In each period: 1. The blogger observes the popularity she has built up with her previous posts (if there are any). 2. She decides whether to post a fashion look. If she posts, she simultaneously chooses the brand and style. If not, she goes to the next period. 3. The number of peer likes for the new post (if there are any) realizes. The next period comes. Figure 10. Timing of Events Period Observe #likes of previous posts Post No Next Period Yes Decide: brands and styles 4.1. The Basic Model Let St ", Br " denote the decision on style and brand. P " is the binary decision of posting. The per-period utility of blogger i in period t follows a nested constant elasticity of substitution (CES) format (Solow, 1956):
22 u " St ", Br ", P " S ", θ = F " S ", θ R " (St ", Br " θ ) 1 P " = 1 + ε (1) where R " St ", Br " θ captures the utility gain from the fashion look attributed to the brand Br " and style St ". R " St ", Br " θ = α Br " " + 1 α St " " ", where the elasticity of substitution between style and brand is r = ", and α is the share parameter. In our study, we regard the brand value as the incremental value associated with the brand name that is not related to any style attribute. For example, apart from any style features, people choose luxury brands because they work as a social label and provide hedonic rewards. F " ( ) captures the valuation of a post. It measures the effect of popularity and individual fixed effect on the utility, apart from the brand and style choices. F " S ", θ = η + η ln 1 + SumLike,. SumLike, is the cumulative number of likes user i got from the fashion looks that she posted in the past t 1 periods. In the per-period utility function, ε " is the brand-and-style choice specific random error, following a Type-1 extreme value distribution. Brand choice The brand choices are discrete. The blogger makes brand choice B " from categories of fast fashion (level 1), designer (level 2), and mega couture (level 3), respectively denoted by l {1,2,3}. For each brand level, the blogger decides how many items to include in a post. The brand choice for a fashion post is characterized by the following linear function. 12 Br " = exp γ, x ", + γ," x ", x ",, (2) 12 We apply exp(.) to make sure the brand choice measure is positive so that it is a valid input of the CES function. If there is no brand information for a tagged item, we assume others belief is level 1; otherwise, the user would disclose the brand information. This is consistent with the data fact that the majority of brands are level 1 demonstrated in Appendix, and conforms to consumer rationality, given higher-end brands attract more likes.
23 where x ", denotes the number of clothing items of brand category l, in the fashion look posted by blogger i in period t. γ " captures the utility gain of choosing an additional item of brand l. γ," measures the utility gain of matching items from brand category l and k. Style choice The bloggers make style choices. The style, as a factor of the whole fashion look, is incorporated as a sub-nest of the CES utility function. St " = α f ", + (1 α )f ",, (3) where α is the share parameter, and f ",, f ", denote the choices of compatibility and distinctiveness. The elasticity of substitution between the two style features is r =. Budget and cost The blogger s decisions are subject to a budget constraint y. Specifically, t " f ", + t ", x ", y. The cost of purchasing a clothing item is allowed to change with Like. t ", = t, 1 + δ ln (1 + SumLike, ), where l {1,2,3}, and t, is the baseline cost for obtaining an item with brand-level l. δ measures the decreasing effect of the cumulative number of likes on the cost of brand choices. Bloggers may incur less cost if they are valuable to the fashion companies, as influencers can help market their products to the public. The more followers (measured by SumLike, ) a user has, the more valuable she is to the fashion company, because her posts will influence a broader
24 audience who potentially can become customers. This is demonstrated by the fact that many fashion bloggers are paid millions every year by fashion companies. 13 For identification purposes, we normalize the base cost for a fast fashion brand to 1 that is, t, = 1. The budget constraint for blogger i, y, measures the highest cost a blogger is willing to pay for the fashion consumption, and it is assumed fixed over weeks, as the time and pecuniary resources allocated to other regular activities (e.g., working, entertainment) typically do not change much over weeks. In estimation, the budget constraint is calculated by the highest ever cost since the user started posting State Variables The state variables are S " = face, body, age, gender, SumLike,, ε ", where SumLike, is time varying while others are fixed for the same user. With f it = f ",, f ", and x it = x ",, x ",, x,, the state transition follows Like " = g (SumLike,, face, body, age, gender, f it, x it ) + ζ " where g ( ) is estimated by a linear regression as the first step, and ζ N 0, σ. In our dataset, we observe S " = face, body, age, gender, SumLike,. The state transition regression results are shown in section Inter-temporal Tradeoff Each user decides on an infinite sequence of decision rules f ", x ", post " to maximize the expected discounted utility. Substituting the brand and style choices (equation (2) and (3)) to the per-period utility function (equation (1)), we have where max E ", ", " β " U f it, x it, P " S ", θ x, f, P, S, 13
25 U f it, x it, P " S ", θ = " η + η ln 1 + SumLike α exp γ, x ", + γ," x ", x ", + 1 " α β f "# + (1 β )f " "# " 1 P " = 1 + ε ". Let V S " denote the value function: V S " = max E f iτ,x iτ, " U f it, x it, P " S ", θ + β " U f iτ, x iτ, P " S ", θ x ", f ", P ", S " The Bellman Equation (Bellman, 1957) for the dynamic optimization problem is expressed as follows: V S " = max ", ", " E " U t f it, x it, P it S it, θ i + βv S " x it, f it, P ", S " All the decisions, that is, f it, x it, P ", are dynamic in the sense that the current period s decisions affect the next period state through SumLike, which further affects the cost and utility of the user s brand and style choices. In other words, the users face inter-temporal tradeoffs regarding the utility derived from the post today versus its impact on the utility of posting tomorrow Heterogeneity In the fashion sharing community, users may have different responses to others opinions. For example, some users care a lot about others opinion (i.e., #likes), whereas some care only about expressing themselves rather than attracting #likes. Similarly, some users base their utility heavily on the brand levels, whereas others care more about the clothing styles. Therefore, we employ a hierarchical Bayesian framework (Rossi et al., 2005) to account for heterogeneity. All structural parameters θ Θ i = α, α, ρ i, η i, t i, γ i, δ have random coefficient specification. 14 The prior distribution is normal for η i, γ i, and log normal for α, α, r i, t i, δ, where r i = ρ i. The prior distribution is specified as N μ, σ distribution for all parameters.. We use diffuse hyper-prior 14 The parameters in bold are vectors with subscription 1,2, etc. as specified in the model.
26 5. Identification and Estimation 5.1. Identification In our model, the unknown parameters include those in the state transition process (b) and the primitives in the utility function (Θ i ). We briefly explain the identification of the key parameters. First of all, the transition function parameters can be identified by the variation in the number of likes Like, and the corresponding fashion brands, style features, and blogger demographics (i.e., SumLike,, face, body, age, gender, f it, x it ). For the discount factor β, as acknowledged in the literature (e.g., Rust, 1987), it cannot be separately identified from the utility parameter, that is, the individual-fixed effect in our context. Therefore, following the conventional approach, we fixed the weekly discount at to stay consistent with the literature (Hartmann & Nair, 2010; Liu et al., 2018). Table 9. Summary of the Parameters Notation Explanation α α ρ i Share parameter for brand and style. Share parameter for different style features. Elasticity of substitution, ρ i = ρ, ρ, for brand versus style, and between style features. η i Governing the efficiency or productivity. η i = η, η, where η captures individual fixed-effect, η measures the effect from the cumulative likes. t i Cost parameters for brand and style choices. t i = t, t, t ", t ". γ i Utility gain from an item of a certain brand level, γ i = γ ", γ ", γ ", γ,", γ,", γ,". δ The costing decreasing effect from cumulative #likes (as a proxy for #followers). The elasticity of substitution between brand and style can be identified by the variation in the brand (Br " ) and style choices (St " ) across time. Similarly, the elasticity of substitution between compatibility and distinctiveness can be identified by the variation in the two style choices across periods. The brand and style choices help us back out the underlying cost of each blogger. We
27 can separately identify the effect of SumLike on the utility (η ) and on the cost (δ ), because the cost decreasing effect is only on the brand choices, whereas η affects both the brand and style choices in the same way. So, the different evolving patterns of brand and style choices can help us identify η and δ. In summary, the structural parameters to be estimated are Θ i = α, α, ρ i, η i, t i, γ i, δ Likelihood The likelihood function is Likelihood = L f it, x it, P it S, θ L g S " S ", f it, x it, P it L S where S " includes all the observable states. According to the above likelihood function, the likelihood for the state transition process and that for the optimal choices can be separately estimated. Our data cover the entire history of activities for each individual, and everyone starts with Like " = 0. As the first step, we estimate the state transition process, g ( ), with a linear regression. Then we maximize the likelihood of the optimal choices: L f it, x it, P it S ", θ = L f it, x it, P it S ", θ where the brand choices x it are discrete and style choices f it are continuous., The likelihood for each choice f it, x it, P ", consisting of both discrete and continuous choices, can be calculated through a discrete way. Note that for each combination of choice, f it, x it, P ", the predicted number of likes can be obtained with the estimated transition regression model that is, Lıke " = g (Like,, face, body, age, gender, f it, x it ) 1 P " = 1. Then, we can first eliminate all style choices that are strictly dominated. Specifically, the assumption of blogger rationality implies a unique choice set f it, x it, P " corresponding to the set Lıke ", x it, P ". With the CES utility functional form, there exist unique closed-form solutions for f it given Lıke ", x it, P ". To put it in math, given x it, P ", the optimal choices of f it are unique for each Lıke ", obtained by solving the following maximization problem: max "# β f "# + (1 β )f "#
28 subject to g f it x it, P ", S " = Lıke " and t f "# + t " x ", y. Therefore, styles choices that satisfy f it f it but lead to the same Lıke " are strictly dominated, thus will never be chosen. With this observation, we can further relieve the computation burden by acting on Lıke " instead of multiple choices f it. Please see the appendix for details about how we transform the continuous choice space for f it into a discrete action space on Lıke " while reserving the continuous nature of the style choices. The likelihood of the optimal choices can be expressed as L f it, x it, P " S ", θ Pr Lıke ", x it, P " S ", θ = = L f it, x it, P " S ", θ With Type-1 extreme value distribution for the random error, the choice probability can be written as:. Pr Lıke ",, x it,n, P it,n S ", θ i = exp υ Lıke ",, x it,n, P it,n S ", θ i exp υ Lıke ",, x it,n, P it,n S ", θ i where υ Like it,n, x it,n, P it,n S it = U f it,n, x it,n, P it,n S it ε it,n, and f it,n are observed from the data or backed out from Lıke ",, x it,n if there is no post in that period. N is the total number of discrete choices. According to the data, in a fashion look, there are up to three items tagged as brand level 1, while there are up to two items tagged as brand level 2 (designer) and 3 (couture). 15 For fashion looks without brand tags, we assume audiences belief about the brand level is fast fashion (level 1), which is consistent with the majority observation and rational behavior of tagging. 16 Therefore, there are = 35 brand choices if one decides to post in our context. The choice of target #likes can be from 0 to the largest #likes the bloggers have gotten on the website, which is Together with the choice 15 There are only fewer than 1% posts tagging more than the upper limits of brands; therefore, we bound the choices below 3, 2, 2 respectively for each level of brand. Though there are cases where people wear the same clothing item in multiple posts, they do not tag the same item, and there must some other new items across different posts. 16 If the items are of higher-level brands, the consumer would tag them given the belief that no-tagged brands are level 1, because the fixed-effect regression indicates that a higher-level brand contributes positively to #likes.
29 of not posting, the bloggers have in total N = 35 M + 1 discrete choices. For ease of computation, we can shrink the choice space for an individual according to the historical #likes she has gotten, plus some deviation based on σ Estimation Methods To estimate the infinite horizon dynamic structural model, we explore several methods, including the conditional choice probability estimation (CCP) (Hotz & Miller, 1993; Aguirregabiria & Mira, 2007; Arcidiacono & Miller, 2011), the simulated method of moments (SMM) (Pakes & Pollard, 1989; McFadden, 1989), and the Bayesian estimation method (Imai, Jain, & Ching, 2009 (IJC)). SMM matches data moments with simulated moments, but it requires fully solving the dynamic optimization problem and is thus computationally very costly; moreover, it cannot capture the rich heterogeneous responses across different individuals. The CCP methods improve on the computational efficiency but can recover only very limited heterogeneity. The IJC method serves our goal to capture rich individual responses, and the computational burden is also alleviated because it requires evaluating the value function only once in each iteration. However, IJC is designed for discrete choice models, but our model includes both discrete and continuous choices. With the modification for the dynamic choice problem explained in section 5.2 (please see more details in Appendix D), we can apply the IJC while reserving the continuous nature of the style choices. 6. Results 6.1. Model Comparison We compare our model with the benchmark model without the forward looking and direct utility derived from followers. When bloggers are myopic, they do not consider the impact of today s choice on tomorrow s state, that is, number of followers. When there is no direct utility gain from followers, the only effect of followers is through decreasing cost. The utility gain from followers adds more to the model fitting than forward looking. All four measures show that the proposed model outperforms the benchmarks significantly.
30 Table 10. The Proposed Model vs. Alternative Models No forward-looking No utility from followers Proposed Hit Rate: Post Hit Rate: Fast Fashion Hit Rate: Designer Hit Rate: Mega Couture Parameter Estimates Table 11 shows the transition process estimated with an OLS regression. We can see that popularity does have a substantial positive effect on the peer likes for a new fashion post. The number of clothing items has increasingly positive effects with higher brand levels. More attractive faces attract more likes. The average audience likes a lower BMI, younger looks, and male models. We also see a significant positive effect of compatibility. The distinctiveness does not show a significant impact on attracting likes. The negative effect of the interaction term between high-street brands and mega couture brands shows that people do not respond favorably to outfits that match low and high-end brands together. However, the positive effect of including either a fast fashion brand or a mega couture brand dominates the negative interaction effect. Table 12 reports the results for structural parameters. The estimation converges with 7000 iterations. We ran 10,000 iterations and report the results using the last 2000 iterations after burn-in. 17 Figure 11 shows the histogram of some structural parameters across individual bloggers. The mean elasticity of substitution is r = 1/(1 ρ ) = 1.24 and implies that styles and brands are quite substitutable for most bloggers. In other words, they find it easy to substitute a high-end brand with good style to derive the same utility. As shown in Figure 11, 60.11% of the individuals treats style and brands as substitutes. For this group of consumers, high-end brands may need to worry about the copycats cannibalization effect. For the the rest 39.89% users, they view style and brand as complements, meaning they will not be lured by only good styles, which makes the copycat problem less worrisome. 17 Convergence was visually assessed with plots of the structural parameters. We store 100 past pseudo-value functions.
31 Table 11. Regression of State Transition VARIABLES OLS Standard Error Log (1+#Like_t-1) 12.74*** # Fast fashion (level 1) 8.814*** # Designer (level 2) 15.72** # Mega couture (level 3) 24.18*** Face 5.768*** BMI *** Age *** Gender 2.952*** Compatibility 0.151*** Distinctiveness Level 1*Level Level 1*Level ** Level 2*Level Constant *** Observations 21,093 R-squared Note: # denotes the count of ; Robust standard errors; Observations are collapsed at weekly level; *p<0.01, **p<0.001, ***p< The estimates of η indicate that most people (about 80%) value popularity or others attention, but there exists large heterogeneity across individuals, with a standard deviation of There are about 21.92% users have negative value for popularity, probably because they feel uncomfortable or stressful when more people are watching and paying attention to them. This group of users may post for archiving or escapism, which requires less or no other people s attention. From the third plot of Figure 11, we see there is also a large cost decreasing effect of popularity. This is consistent with the fact that influential bloggers are hired by fashion companies to promote their products.
32 Table 12. Structural Model Estimation Results Variable Interpretation Mean (μ ) Standard deviation (σ ) α (0.0059) (0.0181) Share parameter α (0.0054) (0.0172) ρ (0.0173) (0.0135) Elasticity of substitution ρ (0.0221) (0.0151) η Fixed effect (0.0265) (0.0205) η t t t, t, γ γ γ γ ", γ ", γ ", Effect of cumulative #likes Cost for style choices Cost for brand choices Gain from brand choices Cost decreasing effect from δ cumulative #likes. Note: Standard errors in parentheses (0.0181) (0.0263) (0.0213) (0.0224) (0.0292) (0.0311) (0.0161) (0.0208) (0.0212) (0.0228) (0.0209) (0.0220) (0.0152) (0.0178) (0.0172) (0.0143) (0.0177) (0.0174) (0.0162) (0.0178) (0.0177) (0.0176) (0.0146) (0.0156)
33 Figure 11. Distribution of Structural Parameters across Individuals 140 Elasticity of Substitution between Brand and Style 120 Number of Individuals Complements 39.89% Substitutes 60.11% Elasticity of Substitution 45 Histogram of Followers' Effect on Utility Number of Individuals % 78.08% Followers' Effect on Utility 100 Histogram of Followers' Cost Effect Number of Individuals Cost Decreasing Effect
34 7. Counterfactual Studies 7.1. If Fast Fashion Cannot Copy Mega Couture Styles We wanted to see what would happen to consumers choices if copyright law provided more protection for fashion designs. In this counterfactual world, the fast fashion companies are prohibited from producing styles similar to the original fashion styles of mega couture brands. As a result, the style choices at the fast fashion level would be more restricted. Specifically, the styles of the high-end brands become relatively more exclusive or distinctive, whereas the styles at the fast fashion level become not distinctive, according to our measurement of distinctiveness. Moreover, as fast fashion companies cannot produce copycat styles in the counterfactual world, if consumers wear both the high-end and low-end styles together, the compatibility would be much lower than before. How would exactly the style options change? For each mega couture item, we first calculate its distance to all other fast fashion items, using the vector representation. We experimented by dropping the fast fashion styles with 10% and 5% smallest distance (largest similarity) and replace the removed ones with the average of the other fast fashion styles. Then we calculate the distinctiveness for the fast fashion styles, and the highest compatibility between a fast fashion and a higher-end brand. We observe the remaining fast fashion styles are below about 25 percentile of the mega couture styles. Therefore, we operationalize the analysis by restricting the distinctiveness of the fast-fashion styles to be bounded below 25 percentiles of the styles from the mega couture brands. We also restrict the compatibility of matching fast fashion with mega couture brands to be within the bottom quartile of other combinations. The first column of Table 13 shows the results of a hundred simulations. On average, the posting probability drops by 7.92%. Interestingly, not only the fast fashion brands are worse off, but also the adoption of all brands decreases. Why are the high-end brands also worse off when copycats are prohibited? By comparing consumers choices in the counterfactual world and what they chose before, we found three mechanisms contributing to a lower demand for the mega couture brands. First, many bloggers combine clothing items across brand levels to make a complete outfit. When the style choice is restricted at low-end brands, consumers are subject to higher financial pressure to buy high-end brands to get a satisfactory ensemble. In other words, this is driven by
35 the consumers who cannot always afford high-end brands for their ensembles and who therefore mix and match both low-end and high-end brands. The counterfactual policy would put this group of consumers unsatisfied with the styles of mixing and matching high-end and low-end brands together, resulting in them buying nothing. Thus, they end up buying fewer clothes and post less. The data facts (Table 7) suggest that about 80% (86%) of fashion looks incorporating a mega couture (designer) brand also include items at the fast-fashion level, further demonstrating the economic significance of the mix-and-match mechanism in the fashion market. Second, some consumers may not value high-end brands that much. But they can accumulate popularity across time by wearing attractive styles from fast fashion. Once their popularity is high, there are more people following and paying attention to them, then they will derive more value from what they wear, including high-end brands. Therefore, they will be more likely to adopt high-end brands. Third, many consumers cannot afford mega couture brands in the very beginning, so they rely on trendy styles from the low-end brands to build up popularity. Once the popularity is high enough, they start to be able to afford more high-end brands due to the cost decreasing effect of popularity. The three above-mentioned mechanisms are market expansion effect brought by fashion copycats. Our findings demonstrate that copycats market expansion effect dominates the competition effect, leading to a positive net effect on the demand of high-end brands. In addition, the results also show a boost in the choice of compatibility, which for many bloggers is a substitute for distinctiveness Discussion on Firm Strategy As we do not have firm side data and only model the consumers decision making, our results speak to the cases where fast fashion firms do not find a way to dramatically change their styles and firms charge the original price. This section discusses how firms would react to the counterfactual policy and the corresponding demand effect on high-end brand. Fast fashion firms would either put the same effort in designing their own styles, which is less distinctive and matches not well with higher-end brands, but decrease the price to attract more consumers. This escalated price competition would further decrease the demand for mega couture brands. Alternatively, the low-end brands may invest more in coming up a large number
36 of their own styles to make them not only distinctive but also compatible with higher-end brands. We keep ignorant about how they can achieve this goal with the current low price, but one possibility is that they may transform into designer brands, providing better styles but also higher price due to the higher production cost. The demand effect of prohibiting copycats on mega couture brands is most likely still negative because there is only a small proportion of consumers mix and match designer brands with mega couture brands. Regarding mega couture brands strategic reaction, they may start a low-end product line, providing similar styles to those from high-end product line but charge lower price (i.e., umbrella branding). However, in this case, the low-end product line may erode the parent brand s value, and the demand effect is not clear without additional information and further empirical study. The other strategy the mega couture brands may use is to simply lower the price thus attract more demand. In this case, the mega couture brands profit is definitely lower than before because they have to charge a lower price to achieve the same demand. Overall, we can see if fast fashion copycats were prohibited, neither fast fashion firms nor mega couture brands can find an easy way to combat the loss Discussion on Generalizability As we acknowledged upfront, an average consumer may differ from a fashion social media user. To generalize to all other consumers who do not use social media or do not post fashion content on social media, we need further study and additional data which is not available for now. However, we still can try to make the results more generalizable. In our sample, there are around 10% users are professional fashion bloggers who operate their own blogging website. They may have very different incentive than an average consumer. So we exclude these professional bloggers and check the choice change for other users. The results are reported in the second column of Table 13. Compared to the first column, we see the net effect is still negative but with smaller magnitude. This is due to the fact that professional bloggers care more about popularity, and the lack of fast fashion copycats makes it harder to build up popularity. As a result, the value increasing effect and cost decreasing effect of popularity cannot work their way to increase adoption of mega couture brands.
37 7.2. Offline Market: Absence of Follower Effect This provides a similar scenario as the offline fashion market, where people do not have the likes information for what they wear. The posting decision is analogous to the purchase decision. There are two consequences. First, one s utility does not involve the likes impact; second, the cost of purchasing will not decrease over time. We seek to evaluate how less/more likely a blogger would post. This analysis allows us to understand how many more purchases can be achieved by the existence of social media, compared to the traditional offline market. Companies can leverage the follower function of social media to boost their revenue. The results in the fourth column of Table 13 show that there would be a 9.07% drop in post probability if bloggers did not know about others following. High-end brands suffer most with the largest drop in choice probability, because the cost decreasing effect is also deprived, and this affects the purchase of high-end brands most When Brands Are Not Observable As previously mentioned, our data context has a special brand tagging function, which requires users to pinpoint the brands for the clothing items in their fashion look and clearly lists the brands besides the picture. In most other social medium, there is no such feature. Moreover, in the offline market, brand logos are usually hidden or not obvious. In this counterfactual study, we investigate how fashion bloggers make choices if there were no way to inform others about the brand information. Consistent with the main analysis, when there is no brand information for a clothing item, the belief is that it is a high street brand (i.e., low-end brand). The results are shown in the third column of Table 13. The results show that there would be 0.21% fewer posts. The users would post 0.74% more fast fashion brands, but 0.25% fewer designer brands and 0.30% fewer mega couture brands. Moreover, both style features are improved. Intuitively, when higher-end brands cannot be identified, bloggers cannot use high-end brands to attract peer likes anymore. Therefore, for those who care about popularity and peer likes a lot, they have fewer means to achieve the goal, resulting in lower utility from blogging and thus fewer posts. On the other hand, they switch focus to either using more low-end brands or investing more on styles. As the cost of a low-end brand is lower, bloggers would be able to purchase more low-end clothes, resulting in more posts
38 of fast fashion brands. In summary, for higher-end brands, hiding or obscuring the brand logo would benefit the lower-end brands but hurt high-end brands, given all brands can provide similar styles. This result implies that, high-end brands may want to design their brand logos obvious enough to consumers, so that those who care about peer likes would have greater incentive to buy Platform Ranking System: If Sensitive Users Are Prioritized As bloggers value others opinions differently, the website can change the ranking system so that it favors those sensitive bloggers, to incentivize more fashion posts. Effectively, the platform can exogenously change the number of likes a post can get through the ranking system. We run a counterfactual analysis on the top 10% of sensitive bloggers by exogenously giving one more like to their posts. The results in the last column of Table 13 show that, on average, there would be a 0.90% increase in the probability of posting in each period. There is a 0.61%, 0.87%, and 0.89% increase in the number of items posted from brand levels 1, 2, and 3 respectively. Table 13. Results of Counterfactual Studies Counterfactual Policies No copycats No copycats (Sub sample) No brand info No followers Targeted ranking Δ#Posts (%) -7.92% -6.12% -0.21% -9.07% 0.90% Δ#Fast fashion (%) -5.78% -5.52% 0.74% -6.07% 0.61% Δ#Designer (%) -7.68% -6.08% -0.25% % 0.87% Δ#Mega couture (%) % -9.32% -0.30% % 0.89% ΔCompatibility (%) -3.34% -3.51% 99.93% - - ΔDistinctiveness (%) % % 19.88% Contribution and Limitations In the fashion market, it has been argued that the fast fashion brands copy the designs of the high-end fashion brands. This practice can potentially reduce the distinctiveness of the luxury
39 fashion brands thus erode their brand equity. However, there is no systematic study attempting to investigate the impact of fast fashion copycats on high-end brand equity and the underlying reasons. The key challenges limiting such study are the lack of scalable ways to quantify fashion styles and the unavailability of large-scale data on individuals choices over brands and styles. In this paper, we use the user-generated data a large fashion sharing platform and the state-of-theart deep learning methods on image analytics to quantify fashion styles. Given fashion social media users significant impact on fashion trend and demand, understanding their decision process sheds light on fashion consumers choices across population. For fashion goods, brand and style are two of the product attributes consumers care about most. Incentive-wise, fashion bloggers make the tradeoff between self-intrinsic tastes and building up popularity. To figure out the underlying reasons of how fast fashion may affect high-end brands demand, we build a structural model to investigate fashion social media users decision processes that reveals their heterogeneous responses to brands, styles, and popularity. Our results show that styles and brands are quite substitutable for most people. In other words, they find it easy to substitute a high-end brand with good styles to derive the same utility. These are the consumers that high-end brands could lose to the low-end brands providing comparable styles. We also find that most users value being popular (or peer likes), but there exists a large variance in how much they value popularity. This variation explains why some people keep posting even though they get almost zero peer likes all the time. Moreover, we find that a higher popularity can help reduce posting cost which is consistent with the fact that fashion bloggers with lots of followers are sponsored by fashion companies to post about their products. In the main counterfactual analysis, we restrict the availability of style choice for fast fashion brands. The results show that not only the fast fashion brands will suffer, but also the high-end brands will be worse off. This means that a more restrictive copyright law on fashion design may not necessarily help the mega couture brands. We found three mechanisms that contribute to this result. Because the more restricted choice of styles from low-end brands would limit the mixand-match choices for consumers and put them on greater financial constraint to get a satisfactory ensemble of clothes, resulting in them buying less high-end brands. Moreover, the lack of good styles from low-end brands will make it harder for consumers to build up popularity/likeability, which limits the value of what they wear, including high-end brands. A low popularity also makes it unlikely to get a cost reduction from high-end brands. All these
40 reasons indicate that copycats can benefit the high-end brand, as our findings suggest the market expansion effect dominates the competition effect. We also simulate the case where brand information cannot be seen, which is similar to the offline market where brand logos are hidden or other social media where brand tagging is not featured. The results indicate that on average, fast fashion benefits, whereas the high-end brands suffer. Another counterfactual analysis indicates that there would be a 9.07% drop in post probability if users did not know about peer likes, and high-end brands would suffer the most. This scenario is similar to that of the offline market. This analysis, therefore, allows us to understand how many more purchases can be achieved by the mere existence of social media, compared to the traditional offline market. We also find that an alternative ranking system that prioritizes people who more highly value likes can hugely increase the amount of content generated on the platform. There are several limitations of the current paper that call for future studies. First, the style measure is an objective measure, whereas different consumers may evaluate the compatibility and distinctiveness differently. So the interpretation of the results should be based on the objective style measure we use. An ideal scenario is that we get to know how each consumer evaluates styles. Though this is not feasible, future research could do a more targeted analysis if there were more granular information about consumers from lab experiments or surveys and could then match people s evaluations of styles based on these observables. Second, though we tried to capture the most salient factors in a fashion post that is, the model face, the body feature, and the style of clothing items we did not include everything that may affect the likes a post can get. For example, the accessories may matter. The challenge is that although the detection algorithms for fashion items are state-of-the-art, they are not perfect, especially for items that are too small (e.g., earrings and hats are comparatively quite small). Had we been able to use a better detection algorithm or rich training set, we could have incorporated more factors in the model.
41 9. Reference Aguirregabiria, B Y Victor, and Pedro Mira Sequential Estimation of Dynamic Discrete Games. Econometrica 75 (1): Amaldoss, Wilfred, and Sanjay Jain Conspicuous Consumption and Sophisticated Thinking. Management Science 51 (10): Amaldoss, Wilfred, and Sanjay Jain Pricing of Conspicuous Goods: A Competitive Analysis of Social Effects. Journal of Marketing Research 42 (1): Amos, Brandon, Bartosz Ludwiczuk, and Mahadev Satyanarayanan OpenFace: A General-Purpose Face Recognition Library with Mobile Applications. Technical Report CMU-CS, CMU School of Computer Science 16 (118). Arcidiacono, Peter, and Robert Miller Conditional Choice Probability Estimation of Dynamic Discrete Choice Models With Unobserved Heterogeneity. Econometrica 79 (6): Bernhein, Douglas A Theory of Conformity. Journal of Political Economy 102 (5): Borkovsky, Ron N., Avi Goldfarb, Avery M. Haviv, and Sridhar Moorthy Measuring and Understanding Brand Value in a Dynamic Model of Brand Management. Marketing Science 36 (4): Brewer, Marilynn The Social Self: On Being the Same and Different at the Same Time. Personality and Social Psychology Bulletin 17 (5): Fenigstein, A, M. F Scheier, and A.H Buss Public and Private Self Consciousness: Assessment and Theory. Journal of Consulting and Clinical Psychology 43 (4): Girshick, Ross Fast R-CNN. arxiv: v2 [cs.cv]. Goldfarb, Avi, Qiang Lu, and Sridhar Moorthy Measuring Brand Value in an Equilibrium Framework. Marketing Science 28 (1): Ha, Yu-I, Sejeong Kwon, Meeyoung Cha, and Jungseock Joo Fashion Conversation Data on Instagram. International AAAI Conference on Web and Social Media. arxiv: v1 [stat.ml] 13 Apr. Hadsell, Raia, Sumit Chopra, and Yann LeCun Dimensionality Reduction by Learning an Invariant Mapping. Proceedings of the IEEE Computer Society Conference on Computer Vision and Pattern Recognition 2:
42 Hartmann, Wesley R., and Harikesh S. Nair Retail Competition and the Dynamics of Demand for Tied Goods. Marketing Science 29 (2): Helmore, Edward Google Targets Fashion Market. Guardian. Horen, Femke van, and Rik Pieters When High-Similarity Copycats Lose and Moderate- Similarity Copycats Gain: The Impact of Comparative Evaluation. Journal of Marketing Research XLIX (February): Hotz, V Joseph, and Robert a Miller Conditional Choice Probabilities and the Estimation of Dynamic Models. The Review of Economic Studies 60 (3): Hu, Y., L. Manikonda, and S. Kambhampati What We Instagram : A First Analysis of Instagram Photo Content and User Types. Proceedings of the Eight International AAAI Conference on Weblogs and Social Media. Imai, Susumu, Neelam Jain, and Andrew Ching Bayesian Estimation of Dynamic Discrete Choice Models. Econometrica 77 (6): Kamakura, Wagner A, and Gary J Russell Measuring Brand Equity with Scanner Data. International Journal of Research in Marketing 10 (1): Keller, Kevin Lane, and Donald R. Lehmann Brands and Branding: Research Findings and Future Priorities. Marketing Science 25 (6): Kocabey, Enes, Mustafa Camurcu, Ferda Ofli, Yusuf Aytar, Javier Marin, Antonio Torralba, and Ingmar Weber Face-to-BMI: Using Computer Vision to Infer Body Mass Index on Social Media. arxiv: v1 [cs.hc]. Kuksov, Dmitri Brand Value in Social Interaction. Management Science 53 (10): Liu, Liu, Daria Dzyahura, and Natalie Mizik Visual Listening In: Extracting Brand Image Portrayed on Social Media. Working Paper. Liu, Ziwei, Ping Luo, Shi Qiu, Xiaogang Wang, and Xiaoou Tang DeepFashion: Powering Robust Clothes Recognition and Retrieval with Rich Annotations IEEE Conference on Computer Vision and Pattern Recognition (CVPR), no. 1: Ma, Liye, Alan L Montgomery, and Michael D Smith The Dual Impact of Movie Piracy on Box - Office Revenue : Cannibalization and Promotion. Working Paper. Nam, Hyoryung, Yogesh V. Joshi, and P.K. Kannan Harvesting Brand Information from Social Tags. Journal of Marketing 81 (4):
43 Oberholzer-Gee, Felix, and Koleman Strumpf The Effect of File Sharing on Record Sales: An Empirical Analysis. Journal of Political Economy 115 (1): Qian, Yi Impacts of Entry by Counterfeiters. The Quarterly Journal of Economics 123 (4): Qian, Yi Counterfeiters: Foes or Friends? How Counterfeits Affect Sales by Product Quality Tier. Management Science 60 (10): Simmel, Georg Fashion. International Quaterly 10 (22): Smith, M D, and R Telang Competing with Free: The Impact of Movie Broadcasts on DVD Sales and Internet Piracy. MIS Quarterly 33 (2): Szegedy, Christian, Wei Liu, Yangqing Jia, Pierre Sermanet, Scott Reed, Dragomir Anguelov, Dumitru Erhan, et al Going Deeper with Convolutions. CVPR. Toubia, Olivier, and Oded Netzer Idea Generation, Creativity, and Prototypicality. Marketing Science 36 (1): Veit, Andreas, Balazs Kovacs, Sean Bell, Julian Mcauley, Kavita Bala, and Serge Belongie Learning Visual Clothing Style with Heterogeneous Dyadic Co-Occurrences. arxiv: v1 [cs.cv]. Wang, Quan, Beibei Li, and Param Vir Singh Copycats versus Original Mobile Apps: A Machine Learning Copycat Detection Method and Empirical Analysis. Information Systems Research 29 (2): Yoganarasimhan, Hema Cloak or Flaunt? The Fashion Dilemma. Marketing Science 31 (1):
44 Appendix A. More on summary statistics Table 14 shows how many times each brand appears in the posts in total. Table 14. Frequency of brands (Top 60) Brand Count Brand Count Brand Count Brand Count H&M Dr. Martens 2743 GUESS 1490 Celine 895 Zara Topman 2546 Adidas 1393 Prada 876 Forever Stradivarius 2376 Diy 1382 Choies 847 Topshop River Island 2325 Cheap Monday 1359 Blanco 793 Vintage 8493 Aldo 2265 Shein 1306 Gucci 788 Mango 5518 Pull&Bear 2169 Uniqlo 1288 J. Crew 783 Primark 5504 Nike 2160 Marc by Marc Jacobs 1258 Ralph Lauren 776 Asos 5329 Thrifted 2051 Louis Vuitton 1156 C&A 772 American Apparel 5006 Jeffrey Campbell 2040 Cotton On 1139 Vero Moda 768 Converse 3922 Vans 1978 New Yorker 1106 Old Navy 755 Ray-Ban 3716 Chanel 1836 Gina Tricot 1053 Nine West 749 Levi s(r) 3597 Gap 1644 Monki 957 Calvin Klein 742

45 Urban Outfitters 3450 Steve Madden 1575 OASAP 908 Pimkie 732 New Look 3271 Romwe 1564 Target 902 Alexander Wang 732 Bershka 3169 Michael Kors 1523 FrontRowShop 901 Saint Laurent 671 B. Survey We are interested in assessing the aesthetic quality of human photos on three factors: clothing compatibility, facial attractiveness and body attractiveness. These are subjective measures, but you can guide your judgments according to the following instruction and examples. Instruction. 1. Clothing Compatibility: how well the clothing items match together. Example. The 1st item is compatible with the 2nd item but not compatible with the 3rd item. 2. Facial (Body) attractiveness is the degree to which a person's facial (body) features are considered aesthetically pleasing or beautiful. Below are some general aspects you can refer to.

46 Examples. Below we offer some examples of faces and bodies with different attractiveness levels (1 to 10). Please look at these examples to set your expectations.
![Questions. [Picture given here] Please answer the following questions regarding the given picture.](/docs-images/96/126813169/images/47-0.jpg "For the first two questions, please disregard clothing styles and focus only on face (body) attractiveness: [Compatibility] Do you think the clothing items in the photo are compatible (match well)?")
47 Questions. [Picture given here] Please answer the following questions regarding the given picture. For the first two questions, please disregard clothing styles and focus only on face (body) attractiveness: [Compatibility] Do you think the clothing items in the photo are compatible (match well)? Yes/No [Body attractiveness] How attractive do you think the person s body is? (1: least attractive, 10: most attractive) (Scale 1~10)
Case Study Example: Footloose
 Case Study Example: Footloose Footloose: Introduction Duraflex is a German footwear company with annual men s footwear sales of approximately 1.0 billion Euro( ). They have always relied on the boot market
Comparison of Women s Sizes from SizeUSA and ASTM D Sizing Standard with Focus on the Potential for Mass Customization
 Comparison of Women s Sizes from SizeUSA and ASTM D5585-11 Sizing Standard with Focus on the Potential for Mass Customization Siming Guo Ph.D. Program in Textile Technology Management College of Textiles
What is econometrics? INTRODUCTION. Scope of Econometrics. Components of Econometrics
 1 INTRODUCTION Hüseyin Taştan 1 1 Yıldız Technical University Department of Economics These presentation notes are based on Introductory Econometrics: A Modern Approach (2nd ed.) by J. Wooldridge. 14 Ekim
Case study example Footloose
 Case study example Footloose Footloose Introduction Duraflex is a German footwear company with annual men s footwear sales of approximately 1.0 billion Euro( ). They have always relied on the boot market
Growth and Changing Directions of Indian Textile Exports in the aftermath of the WTO
 Growth and Changing Directions of Indian Textile Exports in the aftermath of the WTO Abstract A.M.Sheela Associate Professor D.Raja Jebasingh Asst. Professor PG & Research Department of Commerce, St.Josephs'
Consumer and Market Insights: Skincare Market in France. CT0027IS Sample Pages November 2014
 Consumer and Market Insights: Skincare Market in France CT0027IS Sample Pages November 2014 Example table of contents Introduction Category classifications Demographic definitions Summary methodology Market
2013/2/12 HEADACHED QUESTIONS FOR FEMALE. Hi, Magic Closet, Tell me what to wear MAGIC CLOSET: CLOTHING SUGGESTION
 HEADACHED QUESTIONS FOR FEMALE Hi, Magic Closet, Tell me what to wear Si LIU 1, Jiashi FENG 1, Zheng SONG 1, Tianzhu ZHANG 3, Changsheng XU 2, Hanqing LU 2, Shuicheng YAN 1 1 National University of Singapore
Attributes for Improved Attributes
 Attributes for Improved Attributes Emily Hand University of Maryland College Park, MD emhand@cs.umd.edu Abstract We introduce a method for improving facial attribute predictions using other attributes.
C. J. Schwarz Department of Statistics and Actuarial Science, Simon Fraser University December 27, 2013.
 Errors in the Statistical Analysis of Gueguen, N. (2013). Effects of a tattoo on men s behaviour and attitudes towards women: An experimental field study. Archives of Sexual Behavior, 42, 1517-1524. C.
ALASKA GROSS STATE PRODUCT
 ALASKA GROSS STATE PRODUCT 1961-1998 by Scott Goldsmith Professor of Economics prepared for Alaska Department of Commerce and Economic Development June 1999 Institute of Social and Economic Research University
STYLOPEDIA. Team 4 Kiran Viswanathan Vanitha Venkatanarayanan Prasad Kodre Prathamesh Bhurke 5/13/2014
 2014 STYLOPEDIA Team 4 Kiran Viswanathan Vanitha Venkatanarayanan Prasad Kodre Prathamesh Bhurke 5/13/2014 Table of Contents Introduction... 2 Revenue Model... 2 Competitor Analysis... 3 Key Scenarios...
Visual Search for Fashion. Divyansh Agarwal Prateek Goel
 Visual Search for Fashion Divyansh Agarwal Prateek Goel Contents Problem Statement Motivation for Deep Learning Previous Work System Architecture Preliminary Results Improvements Future Work What are they
INFLUENCE OF FASHION BLOGGERS ON THE PURCHASE DECISIONS OF INDIAN INTERNET USERS-AN EXPLORATORY STUDY
 INFLUENCE OF FASHION BLOGGERS ON THE PURCHASE DECISIONS OF INDIAN INTERNET USERS-AN EXPLORATORY STUDY 1 NAMESH MALAROUT, 2 DASHARATHRAJ K SHETTY 1 Scholar, Manipal Institute of Technology, Manipal University,
TO STUDY THE RETAIL JEWELER S IMPORTANCE TOWARDS SELLING BRANDED JEWELLERY
 TO STUDY THE RETAIL JEWELER S IMPORTANCE TOWARDS SELLING BRANDED JEWELLERY Prof. Jiger Manek 1, Dr.Ruta Khaparde 2 ABSTRACT The previous research done on branded and non branded jewellery markets are 1)
Extension of Fashion Policy at Purchase of Garment on e-shopping Site
 Advances in Computing 2015, 5(1): 9-17 DOI: 10.5923/j.ac.20150501.02 Extension of Fashion Policy at Purchase of Garment on e-shopping Site Takuya Yoshida 1,*, Phoung Dinh Dong 2, Fumiko Harada 3, Hiromitsu
Global Handbags Market Report
 Global Handbags Market Report ---------------------------------------------------- 2013 Executive Summary Premium handbags and accessories is one of the fastest growing segments in the overall luxury market.
Using firm-level data to study growth and dispersion in total factor productivity
 Using firm-level data to study growth and dispersion in total factor productivity Dany Bahar The Brookings Institution Harvard Center for International Development July 27, 2016 When looking at the evolution
!!!!!!!!!!!!!!!!!!!!!!!!!!!!!!!!!!!!!!!!!!! Anthony Prats Shreya Mantri Jack Zhuang Pratham Shah Yiwen Zhong!!
 Anthony Prats Shreya Mantri Jack Zhuang Pratham Shah Yiwen Zhong Executive Summary Crafted Color stands to revolutionize the relationship between women and their cosmetic products. Cosmetics have existed
INDIAN APPAREL MARKET OUTLOOK
 INDIAN APPAREL MARKET OUTLOOK Market Size by Apparel Type, Gender and Region Trends and Forecast Till 2021 www.fibre2fashion.com 1 ABOUT US Fibre2fashion.com was established in 2000 and is owned and promoted
CHAPTER Introduction
 CHAPTER 1 1. Introduction This section will talk about the background of this research, the problem statement and the aim and purpose of this research. Also, a few literature review, the scope and method
FACIAL SKIN CARE PRODUCT CATEGORY REPORT. Category Overview
 PRODUCT CATEGORY REPORT FACIAL SKIN CARE Category Overview How much do we value the quality of our skin? Apparently, quite a lot. Skin care is one of the fastest-growing and lucrative categories within
SURF and MU-SURF descriptor comparison with application in soft-biometric tattoo matching applications
 SURF and MU-SURF descriptor comparison with application in soft-biometric tattoo matching applications Mikel Iturbe, Olga Kähm, Roberto Uribeetxeberria Faculty of Engineering Mondragon University Email:
About the Report. Booming Women Apparel Market in India
 About the Report "Booming Women Apparel Market in India" is the new report by that give a rational analysis on the Indian women apparel industry. This report has been made to help the client in analyzing
An Introduction to Modern Object Detection. Gang Yu
 An Introduction to Modern Object Detection Gang Yu yugang@megvii.com Visual Recognition A fundamental task in computer vision Classification Object Detection Semantic Segmentation Instance Segmentation
2. The US Apparel and Footwear Market Size by Personal Consumption Expenditure,
 1 TABLE OF CONTENTS 1. The US Apparel and Footwear Market Introduction 2. The US Apparel and Footwear Market Size by Personal Consumption Expenditure, 2005-2010 3. The US Apparel and Footwear Per Capita
COTTON VERSUS SYNTHETICS THE CONSUMER PERSPECTIVE. A. Terhaar Cotton Council International, Washington, D.C., USA
 COTTON VERSUS SYNTHETICS THE CONSUMER PERSPECTIVE A. Terhaar Cotton Council International, Washington, D.C., USA ABSTRACT This article purports to further the argument presented by the author at the 2010
Tips for proposers. Cécile Huet, PhD Deputy Head of Unit A1 Robotics & AI European Commission. Robotics Brokerage event 5 Dec Cécile Huet 1
 Tips for proposers Cécile Huet, PhD Deputy Head of Unit A1 Robotics & AI European Commission Robotics Brokerage event 5 Dec. 2016 Cécile Huet 1 What are you looking for? MAXIMISE IMPACT OF PROGRAMME on
Global Handbags Market
 Global Handbags Market ----------------------------------------------------- 2014 Executive Summary Handbags and accessories are among the fastest growing segments in the overall luxury goods industry.
Higher National Unit Specification. General information for centres. Fashion: Commercial Design. Unit code: F18W 34
 Higher National Unit Specification General information for centres Unit title: Fashion: Commercial Design Unit code: F18W 34 Unit purpose: This Unit enables candidates to demonstrate a logical and creative
The Future of the Male Toiletries Market in the UAE to 2018
 673 1. The Future of the Male Toiletries Market in the UAE to 2018 Reference Code: CT0246MR Report Price: US$ 875 (Single Copy) www.canadean-winesandspirits.com Summary is the result of Canadean s extensive
Clothing longevity and measuring active use
 Summary Report Clothing longevity and measuring active use Results of consumer research providing a quantitative baseline to measure change in clothing ownership and use over time. This will inform work
Clothing & Footwear Retailing in Russia Market Summary & Forecasts
 Clothing & Footwear Retailing in Russia Market Summary & Forecasts Comprehensive overview of the market, consumer, and competitive context, with retail sales value and forecasts to 2018 Report Code: RT0076SR
The Economics of Fashion: Status Motives for Conspicuous Consumption
 The Economics of Fashion: Status Motives for Conspicuous Consumption Rachel A. J. Pownall October 9, 2013 Abstract The current paper reviews the concept of status motives driving conspicuous consumption.
Tattoo Detection Based on CNN and Remarks on the NIST Database
 Tattoo Detection Based on CNN and Remarks on the NIST Database 1, 2 Qingyong Xu, 1 Soham Ghosh, 1 Xingpeng Xu, 1 Yi Huang, and 1 Adams Wai Kin Kong (adamskong@ntu.edu.sg) 1 School of Computer Science and
US Denim Jeans Market Report
 US Denim Jeans Market Report ----------------------------------------- 2015 Executive Summary Denim has become a wardrobe staple for the comfort it offers and above all for being one of the best clothing
Predetermined Motion Time Systems
 Predetermined Motion Time Systems Sections: 1. Overview of Predetermined Motion Time Systems part 1 2. Methods-Time Measurement part 2 3. Maynard Operation Sequence Technique PMTS Defined Problem with
Lecture 6: Modern Object Detection. Gang Yu Face++ Researcher
 Lecture 6: Modern Object Detection Gang Yu Face++ Researcher yugang@megvii.com Visual Recognition A fundamental task in computer vision Classification Object Detection Semantic Segmentation Instance Segmentation
SAC S RESPONSE TO THE OECD ALIGNMENT ASSESSMENT
 SAC S RESPONSE TO THE OECD ALIGNMENT ASSESSMENT A Collaboration Between the Sustainable Apparel Coalition and the Organisation for Economic Cooperation and Development February 13, 2019 A Global Language
Sampling Process in garment industry
 Sampling Process in garment industry Sampling is one of the main processes in garment manufacturing and it plays vital role in attracting buyers and confirming the order, as the buyers generally places
Clothes Recommend Themselves: A New Approach to a Fashion Coordinate Support System
 , October 19-21, 2011, San Francisco, USA Clothes Recommend Themselves: A New Approach to a Fashion Coordinate Support System Mio Fukuda*, Yoshio Nakatani** Abstract Fashion coordination is one of the
Global Handbags Market: Trends, Opportunities and Forecasts ( )
") Global Handbags Market: Trends, Opportunities and Forecasts (2015-2020) By Market Category (Handbags-For Men, For Women) By Price- Premium, Ultra-Premium, Ordinary By Region-North America, Europe, APAC,
Global Handbags Market: Trends, Opportunities and Forecasts (2015-2020) By Market Category (Handbags-For Men, For Women) By Price- Premium, Ultra-Premium, Ordinary By Region-North America, Europe, APAC,
The Use of 3D Anthropometric Data for Morphotype Analysis to Improve Fit and Grading Techniques The Results
 The Use of 3D Anthropometric Data for Morphotype Analysis to Improve Fit and Grading Techniques The Results Abstract Joris COOLS 1*, Alexandra DE RAEVE 1, Peter VAN RANSBEECK 2, Simona VASILE 1, Benjamin
Case Study : An efficient product re-formulation using The Unscrambler
 Case Study : An efficient product re-formulation using The Unscrambler Purpose of the study: Re-formulate the existing product (Shampoo) and optimize its properties after a major ingredient has been substituted.
Mehdi Mahbub CEO & Chief Consultant, Best Sourcing Founder, RMG Bangladesh GLOBAL TRENDS IN THE GARMENT SECTOR AND OPPORTUNITIES FOR BANGLADESH
 GLOBAL TRENDS IN THE GARMENT SECTOR AND OPPORTUNITIES FOR BANGLADESH TECHNOLOGICAL CHANGES AND INNOVATIONS IN THE WORLD BANGLADESH READYMADE GARMENT INDUSTRY, the 2 nd largest apparel exporter of the world:
The Higg Index 1.0 Index Overview Training
 The Higg Index 1.0 Index Overview Training Presented by Ryan Young Index Manager, Sustainable Apparel Coalition August 20 th & 21 st, 2012 Webinar Logistics The webinar is being recorded for those who
This unit is an optional unit included in the framework of the SQA Advanced Certificate /Diploma in Retail Management.
 General information for centres Unit title: Fashion Merchandising (SCQF level 7) Unit code: HT5T 47 Superclass: BA Publication date: August 2017 Source: Scottish Qualifications Authority Version: 01 Unit
Social Reactions Index 2018: Luxury Sector
 Social Reactions Index 2018: Luxury Sector What s inside 03_ CHANEL is the most loved luxury fashion brand of 2018 04_ Revealed: the Top 10 Most Loved Luxury Fashion Brands on Facebook in 2018 05_ Revealed:
DPI Research. Global Breast Implants Market Analysis and Forecast Published: September Breast Implants Market
 Global Breast Implants Market Analysis and Forecast 2016 2022 DPI Research Published: September 2016 DPI Research www.dpiresearch.com Page 1 of 24 Breast augmentation is one of the most popular cosmetic
How to solve China s luxury puzzle
 MAGAZINE How to solve China s luxury puzzle CULTURE ALEX ZHANG, STRATEGIST, MEDIACOM SHANGHAI 04 APR 2017 The rise of China as an economic power has been a boon for luxury brands. From LVMH to Burberry
COMPETENCIES IN CLOTHING AND TEXTILES NEEDED BY BEGINNING FAMILY AND CONSUMER SCIENCES TEACHERS
 Journal of Family and Consumer Sciences Education, Vol. 20, No. 1, Spring/Summer, 2002 COMPETENCIES IN CLOTHING AND TEXTILES NEEDED BY BEGINNING FAMILY AND CONSUMER SCIENCES TEACHERS Cheryl L. Lee, Appalachian
Alexis Taylor Brown Stanton College Preparatory School Duval County Grade: 11 1,193 words
 Alexis Taylor Brown Stanton College Preparatory School Duval County Grade: 11 1,193 words I love fashion! Fashion has always been an immediate and simplistic way for me to express myself without having
Comparison of Boundary Manikin Generation Methods
 Comparison of Boundary Manikin Generation Methods M. P. REED and B-K. D. PARK * University of Michigan Transportation Research Institute Abstract Ergonomic assessments using human figure models are frequently
MarketsandMarkets. Publisher Sample
 MarketsandMarkets http://www.marketresearch.com/marketsandmarkets-v3719/ Publisher Sample Phone: 800.298.5699 (US) or +1.240.747.3093 or +1.240.747.3093 (Int'l) Hours: Monday - Thursday: 5:30am - 6:30pm
UK Influencer Marketing: Insights from Fashion & Style. A snapshot of the data and the factors driving performance on Instagram
 UK Influencer Marketing: Insights from Fashion & Style A snapshot of the data and the factors driving performance on Instagram January 2018 Highlights 29% 30m 2.2% of Instagram sponsored posts estimated
CHAPTER 2 THEORITICAL FRAMEWORK
 9 CHAPTER 2 THEORITICAL FRAMEWORK 2.1 Defining Fashion Before jumping into the other related theories, the fundamental one is defining what fashion is really all about. When considering fashion, the basic
Louis Vuitton in India
 Louis Vuitton in India Module Marketing Management Date: 26- Feb- 2011 A product is a physical thing... the brand has not tangible, physical nor functional properties... yet, it is as real as the product.
A Ranking-Theoretic Account of Ceteris Paribus Conditions
 A Ranking-Theoretic Account of Ceteris Paribus Conditions Wolfgang Spohn Presentation at the Workshop Conditionals, Counterfactual and Causes In Uncertain Environments Düsseldorf, May 20 22, 2011 Contents
The WWI Trade Shock and the Boom of Textile Industry in China
 The WWI Trade Shock and the Boom of Textile Industry in China Cong Liu Shanghai University of Finance and Economics September 1, 2016 Cong Liu (SUFE) WWI and Textile Industry September 1, 2016 1 / 34 Introduction
Line Development. Chapter Objectives. Chapter Objectives. Approaches to Line Planning. Approaches to Line Planning 1/27/12.
 1/27/12 Beyond Design Line By Sandra J. Keiser and Myrna B. Garner Chapter 8 Beyond Design PowerPoint developed by Elizabeth Law Chapter Objectives Chapter Objectives Understand how line plan and trend
Postestimation commands predict estat procoverlay Remarks and examples Stored results Methods and formulas References Also see
 Title stata.com procrustes postestimation Postestimation tools for procrustes Postestimation commands predict estat procoverlay Remarks and examples Stored results Methods and formulas References Also
Apparel, Textiles & Merchandising. Business of Fashion. Bachelor of Science
 Bachelor of Science Apparel, Textiles & Merchandising Business of Fashion Major or Minor in Apparel, Textiles & Merchandising :: Apparel Design Minor We nurture tomorrow s fashion leaders and develop broad-based
BINDIS TOOLKIT. In This Issue. Steps for Bindi development. Measures of Success. Annex: Sustainable models for bindis. 3.
 BINDIS TOOLKIT 3.0 June 2014 How to identify and develop Bindis, community Concierge and Caretakers, to share knowledge, empower women within and across communities. In This Issue Steps for Bindi development
The Denim Industry. When shopping for jeans, individuals have different preferences and needs. Regardless of
 Victoria Malkin Junior, Class of 20 I 0 HOD 2720: Advanced Organizational Theory Fall 2008 The Denim Industry When shopping for jeans, individuals have different preferences and needs. Regardless of style
Chapman Ranch Lint Cleaner Brush Evaluation Summary of Fiber Quality Data "Dirty" Module 28 September 2005 Ginning Date
 Chapman Ranch Lint Cleaner Evaluation Summary of Fiber Quality Data "Dirty" Module 28 September 25 Ginning Date The following information records the results of a preliminary evaluation of a wire brush
Healthy Buildings 2017 Europe July 2-5, 2017, Lublin, Poland
 Healthy Buildings 2017 Europe July 2-5, 2017, Lublin, Poland Paper ID 0113 ISBN: 978-83-7947-232-1 Measurements of local clothing resistances and local area factors under various conditions Stephanie Veselá
Market Analysis. Summary
 Market Analysis Summary Jewelry manufacturing in the U.S. has seen sharp declines in recent years due to strong foreign competition. Many developing countries are in a good position to provide products
Think Before you Ink: Modeling Laser Tattoo Removal
 Think Before you Ink: Modeling Laser Tattoo Removal BEE 453 May 1, 2008 Katherine Cumnock, Leigh Gerson, Jacqueline Stroncek, and Sarah Yagerman Table of Contents 1.0 Executive Summary. 3 2.0 Introduction..
SHAVING PRODUCT CATEGORY REPORT. Category Overview
 PRODUCT CATEGORY REPORT SHAVING Category Overview Shaving is one of the most basic personal grooming tasks. It s a part of both men s and women s regimes, leaving us with a perpetual need for shaving creams
THE ARTIST S RESALE RIGHT: DEROGATION FOR DECEASED ARTISTS CONSULTATION SUMMARY OF RESPONSES
 THE ARTIST S RESALE RIGHT: DEROGATION FOR DECEASED ARTISTS CONSULTATION SUMMARY OF RESPONSES INDEX PAGE Introduction 2 Question 1: Should the UK maintain the derogation for an additional two years? 3 Question
Overview of the Global Textile Industry
 Overview of the Global Textile Industry Bangladesh Cotton & Textile Convention 2007 Dhaka, Bangladesh Topics To Be Considered Global Trends The Trade/Sourcing Outlook Impact of China Market Requirements
Yuh: Ethnicity Classification
 Ethnicity Classification Derick Beng Yuh December 2, 2010 INSTITUTE FOR ANTHROPOMATICS, FACIAL IMAGE PROCESSING AND ANALYSIS 1 Derick Yuh: Ethnicity Classification KIT 10.05.2010 University of the StateBeng
Brand Icons and Brand Selection- A Study on Gold Jewellery Consumers of Selected Branded Gold Jewellery Shops in Kerala
 International Journal of Business and Management Invention (IJBMI) ISSN (Online): 2319 8028, ISSN (Print): 2319 801X Volume 7 Issue 6 Ver. I Jun. 2018 PP 01-07 Brand Icons and Brand Selection- A Study
The Future of Diamonds
 The Future of Diamonds How Social changes and the New Consumers are impacting the diamond sector 1 How Social changes and the New Consumers are impacting the diamond sector 2 SUMMARY ABOUT FORECASTING
Intravenous Access and Injections Through Tattoos: Safety and Guidelines
 CADTH RAPID RESPONSE REPORT: SUMMARY OF ABSTRACTS Intravenous Access and Injections Through Tattoos: Safety and Guidelines Service Line: Rapid Response Service Version: 1.0 Publication Date: August 03,
FOR IMMEDIATE RELEASE
 FOR IMMEDIATE RELEASE Three in Ten Americans with a Tattoo Say Having One Makes Them Feel Sexier Just under Half of Adults without a Tattoo Say Those with One are Less Attractive ROCHESTER, N.Y. February
DIFFERENCES IN GIRTH MEASUREMENT OF BMI BASED AND LOCALLY AVALIABLE CATEGORIES OF SHIRT SIZES
 DIFFERENCES IN GIRTH MEASUREMENT OF BMI BASED AND LOCALLY AVALIABLE CATEGORIES OF SHIRT SIZES Mahlaqa Afreen, Dr Parveen Haq Department of Social Science, Handard University of Education and Social Science.Karachi,
COMMUNICATION ON ENGAGEMENT DANISH FASHION INSTITUTE
 COMMUNICATION ON ENGAGEMENT DANISH FASHION INSTITUTE PERIOD: 31 OCTOBER 2015 31 OCTOBER 2017 STATEMENT OF CONTINUED SUPPORT BY CHIEF EXECUTIVE 31 October 2017 To our stakeholders, It is a pleasure to confirm
Planar Procrustes Analysis
 3 Planar Procrustes Analysis 3.1 Introduction This chapter provides a straightforward introduction to some key concepts when a random sample of planar objects is available. Important aspects of shape analysis
INDIAN JEWELLERY MARKET-METAMORPHOSIS INTRODUCTION
 "A STUDY ON CUSTOMER PREFRENCES-AMONG BRANDED AND NON BRANDED JEWELLERY. Dr. Priyanka Gautam 1 Ms. Urmila Thakur 2 INDIAN JEWELLERY MARKET-METAMORPHOSIS INTRODUCTION Due to rapid progress in the retail
Study of consumer's preference towards hair oil with special reference to Karnal city
 International Journal of Academic Research and Development ISSN: 2455-4197 Impact Factor: RJIF 5.22 www.academicsjournal.com Volume 2; Issue 6; November 2017; Page No. 749-753 Study of consumer's preference
US Denim Jeans Market Report
 US Denim Jeans Market Report ----------------------------------------- 2014 Executive Summary The US apparel industry is large, mature, and highly fragmented. This industry has stretched the boundaries
Course Bachelor of Fashion Design. Course Code BFD16. Location City Campus, St Kilda Road
 Course Bachelor of Fashion Design Course Code BFD16 Location City Campus, St Kilda Road Contact Julie Wright, Course Leader: julie.c.wright @holmesglen.edu.au PUBLIC Holmesglen: bh 19-Dec-2016 Q:\Projects\Higher
MNPE In Collaboration with. Karnataka State Open University. Manasagangotri, Mysore-6. Syllabus Certificate in Fashion Designing
 MNPE-09425068494 In Collaboration with Karnataka State Open University Manasagangotri, Mysore-6 Syllabus Certificate in Fashion Designing www.maanarmadaedu.org Certificate in Fashion Designing Program
The Growing Niche Market of Plus-Size Apparel. Topic Area: Other Areas of Social Science. Presentation Format: Poster
 The Growing Niche Market of Plus-Size Apparel Topic Area: Other Areas of Social Science Presentation Format: Poster Delana Foster, Undergraduate Student Department of Marketing and Management The University
APPAREL, MERCHANDISING AND DESIGN (A M D)
") Apparel, Merchandising and Design (A M D) 1 APPAREL, MERCHANDISING AND DESIGN (A M D) Courses primarily for undergraduates: A M D 120: Apparel Construction Techniques (3-0) Cr. 3. SS. Assemble components
Apparel, Merchandising and Design (A M D) 1 APPAREL, MERCHANDISING AND DESIGN (A M D) Courses primarily for undergraduates: A M D 120: Apparel Construction Techniques (3-0) Cr. 3. SS. Assemble components
Master's Research/Creative Project Four Elective credits 4
 FASHION First offered fall 2010 Curriculum Master of Arts (MA) Degree requirements Course title Credits Master's Research/Creative Project Milestone Four Elective credits 4 Course code Course title Credits
CONSUMER BEHAVIOUR AMONG WOMEN WITH SPECIAL REFERENCE TO COSMETICS ASHOK YAKKALDEVI
 CONSUMER BEHAVIOUR AMONG WOMEN WITH SPECIAL REFERENCE TO COSMETICS Abstract: ASHOK YAKKALDEVI Assistant Professor, Dept. of Sociology, A.R. Burla Mahila Varishtha Mahavidyalaya, Solapur. The present study
Factors driving fashion design industry: Key success factors of Thai designers brands
 The Empirical Econometrics and Quantitative Economics Letters ISSN 2286 7147 EEQEL all rights reserved Volume 1, Number 2 (June 2012), pp. 71 80. Factors driving fashion design industry: Key success factors
Project Management Network Diagrams Prof. Mauro Mancini
 Project Management Network Diagrams Prof. Mauro Mancini e-mail: Mauro.Mancini@polimi.it tel.: +39-02-23994057 POLITECNICO DI MILANO Department of Management, Economics and Industrial Engineering Mauro
Remote Skincare Advice System Using Life Logs
 Remote Skincare Advice System Using Life Logs Maki Nakagawa Graduate School of Humanities and Sciences, Ochanomizu University 2-1-1 Otsuka, Bunkyo-ku, 112-8610, Japan nakagawa.maki@is.ocha.ac.jp Koji Tsukada
Fashion Design Merchandising
 EXAM INFORMATION Items 44 Points 70 Prerequisites NONE Course Length ONE SEMESTER Career Cluster HUMAN SERVICES MARKETING DESCRIPTION Fashion Design Merchandising is an introductory course that teaches
RESULTS AND INTERPRETATION
 CHAPTER 6 RESULTS AND INTERPRETATION 6.1 INTRODUCTION Chapter 6 deals with the factor analysis results and the interpretation of the factors identified for the product category lipstick and the three advertisements
Intelligent Fashion Forecasting Systems: Models and Applications
 Intelligent Fashion Forecasting Systems: Models and Applications Tsan-Ming Choi Chi-Leung Hui Yong Yu Editors Intelligent Fashion Forecasting Systems: Models and Applications 123 Editors Tsan-Ming Choi
Fashion Merchandising and Design. Fashion Merchandising and Design 10
 Fashion Merchandising and Design Fashion Merchandising and Design Fashion Merchandising and Design brings to life the business aspects of the fashion world. It presents the basics of market economics,
NATHAN JOHNSON APOSTOLIC CLOTHING
 NATHAN JOHNSON APOSTOLIC CLOTHING Analysis by Jacob Tapia Introduction The business analysis found in this review is intended to be a broad analysis of Nathan Johnson s business, Apostolicclothing.com.
Overcoming OBI in RFoG Networks. Michael McWilliams ANGA Cologne, Germany June 9, 2016
 Overcoming OBI in RFoG Networks Michael McWilliams ANGA Cologne, Germany June 9, 2016 Agenda Optical Beat Interference (OBI) Causes Analysis Identification Mitigation The answer 2 OBI Causes OBI Occurs
INDUSTRY AND TECHNOLOGY Institutional (ILO), Program (PLO), and Course (SLO) Alignment
, Program (PLO), and Course (SLO) Alignment") Program: ILOs Fashion SLO-PLO-ILO ALIGNMENT NOTES: 1. Critical Thinking Students apply critical, creative and analytical skills to identify and solve problems, analyze information, synthesize and evaluate
Program: ILOs Fashion SLO-PLO-ILO ALIGNMENT NOTES: 1. Critical Thinking Students apply critical, creative and analytical skills to identify and solve problems, analyze information, synthesize and evaluate
Research on Branded Garment Design from the Perspective of Fashion Information
 2017 International Conference on Social Sciences, Arts and Humanities (SSAH 2017) Research on Branded Garment Design from the Perspective of Fashion Information Yixuan Guo School of Business Administration,
FACTS & NUMBERS 2016
 FACTS & NUMBERS 2016 STATISTICAL ANALYSIS 2015 Portugal exported 79 million pairs of shoes, valued at 1 865 million euros. 2015 was the sixth consecutive year with growth in footwear exports Exports have
PARTICULARITIES OF CONSUMER BEHAVIOR IN THE COSMETICS MARKET
 Studies and Scientific Researches. Economics Edition, No 20, 2014 http://sceco.ub.ro PARTICULARITIES OF CONSUMER BEHAVIOR IN THE COSMETICS MARKET Eugenia Harja Vasile Alecsandri University of Bacau eugenia.harja@ub.ro